当前位置:
X-MOL 学术
›
Agric. For. Meteorol.
›
论文详情
Our official English website, www.x-mol.net, welcomes your feedback! (Note: you will need to create a separate account there.)
Mapping the sensitivity of agriculture to drought and estimating the effect of irrigation in the United States, 1950–2016
Agricultural and Forest Meteorology ( IF 6.2 ) Pub Date : 2020-10-01 , DOI: 10.1016/j.agrformet.2020.108124 Junyu Lu , Gregory J. Carbone , Xiao Huang , Kirsten Lackstrom , Peng Gao
Agricultural and Forest Meteorology ( IF 6.2 ) Pub Date : 2020-10-01 , DOI: 10.1016/j.agrformet.2020.108124 Junyu Lu , Gregory J. Carbone , Xiao Huang , Kirsten Lackstrom , Peng Gao
|
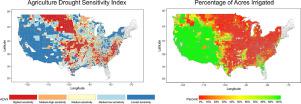
Abstract Drought is a devastating natural hazard posing great threats to agriculture. Identifying the spatial pattern of agricultural sensitivity to drought can provide scientific information for decision-makers to prepare droughts, allocate resources, and mitigate impacts. Here, we use long-term state- and county-level crop data for the 10 major crops: corn grain, soybeans, hay, spring wheat, winter wheat, cotton, corn silage, sorghum, barley, and rice in the United States from 1950 to 2016. First, we perform a correlation analysis between crop yield anomalies and two drought indices (Standardized Precipitation Evapotranspiration Index (SPEI) and Standardized Precipitation Index (SPI)) to identify the sub-seasonal pattern of agricultural sensitivity to drought stress. SPEI performs better than SPI. For most crops, the sensitivity to drought increases in the early period, peaks at the critical months, and then declines. July is the most critical month for crop growth for most crops. Among all crops, soybean and corn grain are most sensitive to drought. Second, we develop an Agriculture Drought Sensitivity Index (ADSI) to quantitatively measure the sensitivity of agriculture to drought stress based on the statistical relationship between the ten major crops and SPEI. We demonstrate that there exists a very strong spatial correspondence between higher sensitivity to drought and the lower percentage of acres irrigated, and vice versa. Also, for those regions with limited irrigation, the sensitivity is higher in arid/semi-arid regions and lower in humid regions in summer. Third, given the importance of irrigation, an analysis of covariance (ANCOVA) shows that the irrigated crop yields have much higher long-run mean yields than non-irrigated crop yields. Fourth, to investigate how irrigation affects drought sensitivity, a panel data regression model shows that the responses of crop growth to drought are non-linear for all crops. Non-irrigated crops are more sensitive to droughts than the irrigated crops, particularly in severe drought conditions. This provides quantitative incentive to use irrigation as an important adaptation and coping strategy to mitigate the drought impacts on agriculture in the US.
中文翻译:

绘制农业对干旱的敏感性并估算美国 1950-2016 年灌溉的影响
摘要 干旱是一种破坏性的自然灾害,对农业构成巨大威胁。确定农业干旱敏感性的空间格局可以为决策者准备干旱、分配资源和减轻影响提供科学信息。在这里,我们使用美国 10 种主要作物的长期州和县级作物数据:玉米粒、大豆、干草、春小麦、冬小麦、棉花、玉米青贮饲料、高粱、大麦和水稻。 1950 年至 2016 年。首先,我们对作物产量异常与两个干旱指数(标准化降水蒸散指数(SPEI)和标准化降水指数(SPI))进行相关分析,以确定农业对干旱胁迫敏感性的亚季节模式。SPEI 的性能优于 SPI。对于大多数作物,对干旱的敏感性在早期增加,在关键月份达到峰值,然后下降。对于大多数作物而言,7 月是作物生长最关键的月份。在所有作物中,大豆和玉米粒对干旱最敏感。其次,我们开发了农业干旱敏感性指数 (ADSI),根据十种主要作物与 SPEI 之间的统计关系,定量衡量农业对干旱胁迫的敏感性。我们证明了对干旱的较高敏感性和较低的灌溉面积百分比之间存在非常强的空间对应关系,反之亦然。此外,对于灌溉量有限的地区,夏季干旱/半干旱地区敏感性较高,潮湿地区敏感性较低。第三,鉴于灌溉的重要性,协方差分析 (ANCOVA) 表明,灌溉作物产量的长期平均产量远高于非灌溉作物产量。第四,为了研究灌溉如何影响干旱敏感性,面板数据回归模型显示作物生长对干旱的响应对于所有作物都是非线性的。非灌溉作物比灌溉作物对干旱更敏感,特别是在严重干旱条件下。这为使用灌溉作为减轻干旱对美国农业影响的重要适应和应对策略提供了定量激励。面板数据回归模型显示,作物生长对干旱的响应对于所有作物都是非线性的。非灌溉作物比灌溉作物对干旱更敏感,特别是在严重干旱条件下。这为使用灌溉作为减轻干旱对美国农业影响的重要适应和应对策略提供了定量激励。面板数据回归模型显示,作物生长对干旱的响应对于所有作物都是非线性的。非灌溉作物比灌溉作物对干旱更敏感,特别是在严重干旱条件下。这为使用灌溉作为减轻干旱对美国农业影响的重要适应和应对策略提供了定量激励。
更新日期:2020-10-01
中文翻译:
绘制农业对干旱的敏感性并估算美国 1950-2016 年灌溉的影响
摘要 干旱是一种破坏性的自然灾害,对农业构成巨大威胁。确定农业干旱敏感性的空间格局可以为决策者准备干旱、分配资源和减轻影响提供科学信息。在这里,我们使用美国 10 种主要作物的长期州和县级作物数据:玉米粒、大豆、干草、春小麦、冬小麦、棉花、玉米青贮饲料、高粱、大麦和水稻。 1950 年至 2016 年。首先,我们对作物产量异常与两个干旱指数(标准化降水蒸散指数(SPEI)和标准化降水指数(SPI))进行相关分析,以确定农业对干旱胁迫敏感性的亚季节模式。SPEI 的性能优于 SPI。对于大多数作物,对干旱的敏感性在早期增加,在关键月份达到峰值,然后下降。对于大多数作物而言,7 月是作物生长最关键的月份。在所有作物中,大豆和玉米粒对干旱最敏感。其次,我们开发了农业干旱敏感性指数 (ADSI),根据十种主要作物与 SPEI 之间的统计关系,定量衡量农业对干旱胁迫的敏感性。我们证明了对干旱的较高敏感性和较低的灌溉面积百分比之间存在非常强的空间对应关系,反之亦然。此外,对于灌溉量有限的地区,夏季干旱/半干旱地区敏感性较高,潮湿地区敏感性较低。第三,鉴于灌溉的重要性,协方差分析 (ANCOVA) 表明,灌溉作物产量的长期平均产量远高于非灌溉作物产量。第四,为了研究灌溉如何影响干旱敏感性,面板数据回归模型显示作物生长对干旱的响应对于所有作物都是非线性的。非灌溉作物比灌溉作物对干旱更敏感,特别是在严重干旱条件下。这为使用灌溉作为减轻干旱对美国农业影响的重要适应和应对策略提供了定量激励。面板数据回归模型显示,作物生长对干旱的响应对于所有作物都是非线性的。非灌溉作物比灌溉作物对干旱更敏感,特别是在严重干旱条件下。这为使用灌溉作为减轻干旱对美国农业影响的重要适应和应对策略提供了定量激励。面板数据回归模型显示,作物生长对干旱的响应对于所有作物都是非线性的。非灌溉作物比灌溉作物对干旱更敏感,特别是在严重干旱条件下。这为使用灌溉作为减轻干旱对美国农业影响的重要适应和应对策略提供了定量激励。


 京公网安备 11010802027423号