当前位置:
X-MOL 学术
›
Remote Sens. Ecol. Conserv.
›
论文详情
Our official English website, www.x-mol.net, welcomes your feedback! (Note: you will need to create a separate account there.)
Detecting northern peatland vegetation patterns at ultra‐high spatial resolution
Remote Sensing in Ecology and Conservation ( IF 5.5 ) Pub Date : 2019-12-17 , DOI: 10.1002/rse2.140 Aleksi Räsänen 1 , Mika Aurela 2 , Sari Juutinen 1 , Timo Kumpula 3 , Annalea Lohila 2 , Timo Penttilä 4 , Tarmo Virtanen 1
Remote Sensing in Ecology and Conservation ( IF 5.5 ) Pub Date : 2019-12-17 , DOI: 10.1002/rse2.140 Aleksi Räsänen 1 , Mika Aurela 2 , Sari Juutinen 1 , Timo Kumpula 3 , Annalea Lohila 2 , Timo Penttilä 4 , Tarmo Virtanen 1
Affiliation
|
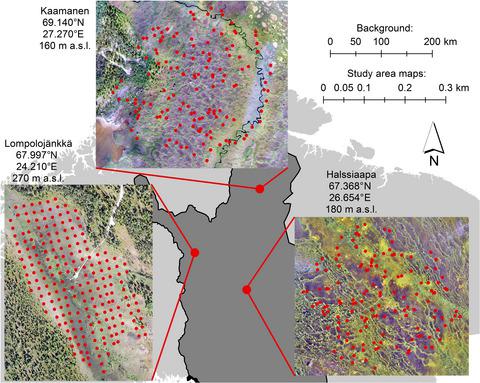
Within northern peatlands, landscape elements such as vegetation and topography are spatially heterogenic from ultra‐high (centimeter level) to coarse scale. In addition to within‐site spatial heterogeneity, there is evident between‐site heterogeneity, but there is a lack of studies assessing whether different combinations of remotely sensed features and mapping approaches are needed in different types of landscapes. We evaluated the value of different mapping methods and remote sensing datasets and analyzed the kinds of differences present in vegetation patterns and their mappability between three northern boreal peatland landscapes in northern Finland. We utilized field‐inventoried vegetation plots together with spectral, textural, topography and vegetation height remote sensing data from 0.02‐ to 3‐m pixel size. Remote sensing data included true‐color unmanned aerial vehicle images, aerial images with four spectral bands, aerial lidar data and multiple PlanetScope satellite images. We used random forest regressions for tracking plant functional type (PFT) coverage, non‐metric multidimensional scaling ordination axes and fuzzy k‐medoid plant community clusters. PFT regressions had variable performance for different study sites (R2 −0.03 to 0.69). Spatial patterns of some spectrally or structurally distinctive PFTs could be predicted relatively well. The first ordination axis represented wetness gradient and was well predicted using remotely sensed data (R2 0.64 to 0.82), but the other three axes had a less straightforward explanation and lower mapping performance (R2 −0.09 to 0.53). Plant community clusters were predicted most accurately in the sites with clear string‐flark topography but less accurately in the flatter site (R2 0.16–0.82). The most important remote sensing features differed between dependent variables and study sites: different topographic, spectral and textural features; and coarse‐scale and fine‐scale datasets were the most important in different tasks. We suggest that multiple different mapping approaches should be tested and several remote sensing datasets used when maps of vegetation are produced.
中文翻译:

以超高空间分辨率检测北部泥炭地植被格局
在北部的泥炭地中,景观元素(例如植被和地形)在空间上是异质的,从超高(厘米级)到粗尺度。除了站点内空间异质性外,站点间异质性也很明显,但是尚缺乏评估不同类型景观中是否需要遥感特征和制图方法的不同组合的研究。我们评估了不同测绘方法和遥感数据集的价值,并分析了芬兰北部三个北方寒带泥炭地景观之间的植被格局差异及其可绘制性。我们利用了现场盘点的植被图以及0.02至3 m像素大小的光谱,纹理,地形和植被高度遥感数据。遥感数据包括真彩色无人机图像,具有四个光谱带的航空图像,激光雷达数据和多个PlanetScope卫星图像。我们使用随机森林回归来跟踪植物功能类型(PFT)的覆盖范围,非度量多维标度协调轴和模糊k-medoid植物群落簇。PFT回归在不同研究地点的表现各不相同(R 2 -0.03至0.69)。可以很好地预测某些在光谱或结构上不同的PFT的空间模式。第一个协调轴表示湿度梯度,并使用遥感数据进行了很好的预测(R 2为0.64至0.82),但其他三个轴的解释较不直观,映射性能也较低(R 2 -0.09至0.53)。在具有清晰串状地形的地方,对植物群落簇的预测最准确,而在平坦的地方,预测的准确性较差(R 20.16-0.82)。最重要的遥感特征在因变量和研究地点之间有所不同:地形,光谱和纹理特征不同;粗数据集和细数据集在不同任务中最为重要。我们建议应测试多种不同的制图方法,并在制作植被图时使用几个遥感数据集。
更新日期:2019-12-17
中文翻译:
以超高空间分辨率检测北部泥炭地植被格局
在北部的泥炭地中,景观元素(例如植被和地形)在空间上是异质的,从超高(厘米级)到粗尺度。除了站点内空间异质性外,站点间异质性也很明显,但是尚缺乏评估不同类型景观中是否需要遥感特征和制图方法的不同组合的研究。我们评估了不同测绘方法和遥感数据集的价值,并分析了芬兰北部三个北方寒带泥炭地景观之间的植被格局差异及其可绘制性。我们利用了现场盘点的植被图以及0.02至3 m像素大小的光谱,纹理,地形和植被高度遥感数据。遥感数据包括真彩色无人机图像,具有四个光谱带的航空图像,激光雷达数据和多个PlanetScope卫星图像。我们使用随机森林回归来跟踪植物功能类型(PFT)的覆盖范围,非度量多维标度协调轴和模糊k-medoid植物群落簇。PFT回归在不同研究地点的表现各不相同(R 2 -0.03至0.69)。可以很好地预测某些在光谱或结构上不同的PFT的空间模式。第一个协调轴表示湿度梯度,并使用遥感数据进行了很好的预测(R 2为0.64至0.82),但其他三个轴的解释较不直观,映射性能也较低(R 2 -0.09至0.53)。在具有清晰串状地形的地方,对植物群落簇的预测最准确,而在平坦的地方,预测的准确性较差(R 20.16-0.82)。最重要的遥感特征在因变量和研究地点之间有所不同:地形,光谱和纹理特征不同;粗数据集和细数据集在不同任务中最为重要。我们建议应测试多种不同的制图方法,并在制作植被图时使用几个遥感数据集。


 京公网安备 11010802027423号