Centro Interdisciplinario de Investigaciones y Estudios sobre Medio Ambiente y Desarrollo (CIIEMAD), Instituto Politécnico Nacional (IPN), Calle 30 de Junio de 1520, Barrio la Laguna Ticomán, Del. Gustavo A. Madero, C.P.07340, Ciudad de Mexico (CDMX), Mexico.
French Institute of Pondicherry, 11 St Louis Street, P.B. 33, Puducherry, 605001, India.
Centre for Remote Sensing, Bharathidasan University, Khajamalai Campus, Tiruchirappalli, 620023, India.
This study aims to report the short-term coastline dynamics and inundation limits of coastal cities along the Eastern Pacific due to the sea swell events that occurred during April to May 2015. The multi-temporal satellite datasets from Landsat such as Enhanced Thematic Mapper (L7 ETM+) and Operational Land Imager/Thermal Infrared Sensor (L8 OLI/TIRS) of different periods before and after the swell events were used to identify the shoreline changes. The satellite images were pre-processed using ERDAS imagine 9.2, and the coastline was digitized in ArcGIS 10.4.1 for ten cities spread across from Mexico to Chile (in Pacific coast) using the spectral water indices, and the shoreline change rate and erosion/accretion pattern at each transect were estimated using the statistical parameters embedded in Digital Shoreline Analysis System (DSAS). The maximum erosion and accretion were observed in El Salvador (268 m) and Huatulco (Mexico) (115 m), respectively. Likewise, the maximum inundation was observed in El Salvador with 268 m and Acapulco (Mexico) with 254 m, and the tide gauge data suggest a possible relation to the bathymetry and the geomorphological conditions of the coast. Overall, the results indicate that the Eastern Pacific Ocean side sea swell events has led to extreme coastal flooding in recent years due to the increase in the mean sea level and the unpredictable variation in El Niño/Southern Oscillation events.
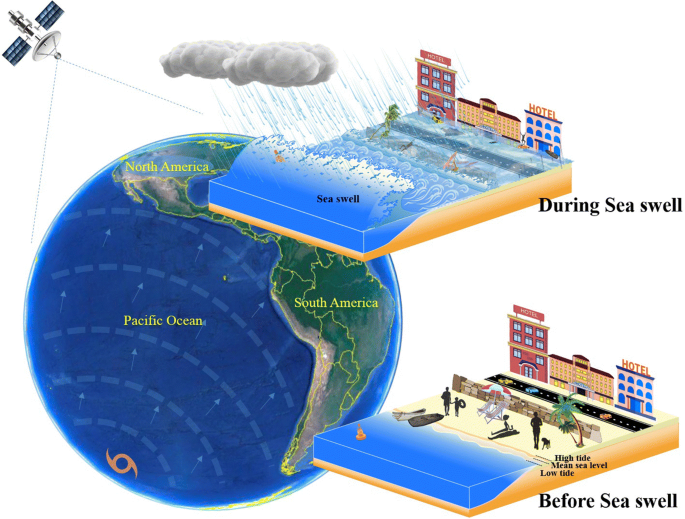
Graphical abstract
 Graphical abstract
 Graphical abstract


 京公网安备 11010802027423号