当前位置:
X-MOL 学术
›
Int. J. Climatol.
›
论文详情
Our official English website, www.x-mol.net, welcomes your feedback! (Note: you will need to create a separate account there.)
Is it possible to fit extreme climate change indices together seamlessly in the era of accelerated warming?
International Journal of Climatology ( IF 3.9 ) Pub Date : 2020-07-10 , DOI: 10.1002/joc.6740 Yizhak Yosef 1, 2 , Enric Aguilar 3 , Pinhas Alpert 1
International Journal of Climatology ( IF 3.9 ) Pub Date : 2020-07-10 , DOI: 10.1002/joc.6740 Yizhak Yosef 1, 2 , Enric Aguilar 3 , Pinhas Alpert 1
Affiliation
|
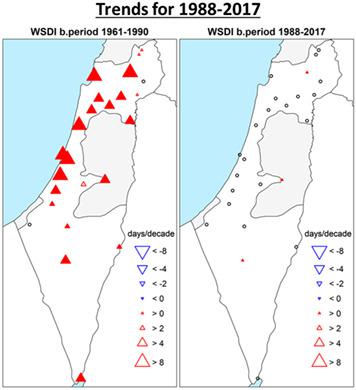
This study examines the problematic impact of selecting a different base period (colder 1961–1990 vs. warmer 1988–2017), on the trend magnitude of widely used percentile‐based extreme temperature indices (e.g., warm/cold spells, warm/cold days and nights). The percentile‐based indices are part of a core set of indices (27 in total) that have become a common standard for monitoring climate change, as recommended by the Expert Team on Climate Change Detection and Indices (ETCCDI). The indices were designed to be comparable across regions provided that similar analyses are employed. Unfortunately, the use of different base periods and periods of interest to explore local and global climate change undermines the comparability of findings across regions. When utilizing “day‐count” indices with fixed thresholds, the use of different base/reference periods changes the intercept without influencing the slope (for a given period length). However, this assertion does not hold with percentile‐based indices. Our analyses show that percentile‐based temperature indices (e.g., days with temperature below the 10th or above the 90th percentiles) are particularly susceptible to the problematic use of different base periods. Hence, using percentile‐based indices may have adverse effects on researchers' conclusions. The current paper reports the results of a comparative study that used different base periods for the most commonly used percentile‐based extreme temperature indices. It was found that the (negative) trend magnitude of the cold percentile‐based indices (frequency of cold days and nights and cold spells) is strongly amplified while the (positive) trend magnitude of the warm indices (frequency of warm days and nights and warm spells) is dramatically diminished when percentiles were derived from a base period that included records from the last two decades (e.g., 1981–2010, 1988–2017). These features are even more pronounced when the study period covers only the last 30–40 years.
中文翻译:

在加速变暖的时代是否可以将极端气候变化指数无缝地整合在一起?
这项研究研究了选择不同的基准时段(colder 1961–1990与温暖的1988–2017)对广泛使用的基于百分位数的极端温度指数(例如,温暖/寒冷,温暖/寒冷的日子)的趋势幅度的影响。和夜晚)。基于百分位的指数是核心指数集(共27个)的一部分,这些核心指数已成为气候变化检测和指数专家组(ETCCDI)推荐的监测气候变化的通用标准。如果采用类似的分析方法,则该指数被设计为可在各个地区进行比较。不幸的是,使用不同的基准期和兴趣期来探索本地和全球气候变化破坏了跨地区结果的可比性。当使用固定阈值的“天数”索引时,使用不同的基准/参考周期可以改变截距,而不会影响斜率(对于给定的周期长度)。但是,此断言不适用于基于百分位的索引。我们的分析表明,基于百分位数的温度指数(例如,温度低于10的天数个或以上的90个百分位数)特别容易出现使用不同基准期的问题。因此,使用基于百分位的指数可能会对研究人员的结论产生不利影响。本论文报告了一项比较研究的结果,该研究对最常用的基于百分位数的极端温度指数使用了不同的基期。结果发现,基于冷百分位的指数(冷昼夜和寒冷季节的频率)的(负)趋势幅度被强烈放大,而温暖指数的(正白天和黑夜的频率和寒冷季节的频率)正(负)趋势幅度被强烈放大。如果百分位数来自一个基期,而该基期包括最近两个十年的记录(例如1981–2010、1988–2017),则温暖的咒语会大大减少。
更新日期:2020-07-10
中文翻译:
在加速变暖的时代是否可以将极端气候变化指数无缝地整合在一起?
这项研究研究了选择不同的基准时段(colder 1961–1990与温暖的1988–2017)对广泛使用的基于百分位数的极端温度指数(例如,温暖/寒冷,温暖/寒冷的日子)的趋势幅度的影响。和夜晚)。基于百分位的指数是核心指数集(共27个)的一部分,这些核心指数已成为气候变化检测和指数专家组(ETCCDI)推荐的监测气候变化的通用标准。如果采用类似的分析方法,则该指数被设计为可在各个地区进行比较。不幸的是,使用不同的基准期和兴趣期来探索本地和全球气候变化破坏了跨地区结果的可比性。当使用固定阈值的“天数”索引时,使用不同的基准/参考周期可以改变截距,而不会影响斜率(对于给定的周期长度)。但是,此断言不适用于基于百分位的索引。我们的分析表明,基于百分位数的温度指数(例如,温度低于10的天数个或以上的90个百分位数)特别容易出现使用不同基准期的问题。因此,使用基于百分位的指数可能会对研究人员的结论产生不利影响。本论文报告了一项比较研究的结果,该研究对最常用的基于百分位数的极端温度指数使用了不同的基期。结果发现,基于冷百分位的指数(冷昼夜和寒冷季节的频率)的(负)趋势幅度被强烈放大,而温暖指数的(正白天和黑夜的频率和寒冷季节的频率)正(负)趋势幅度被强烈放大。如果百分位数来自一个基期,而该基期包括最近两个十年的记录(例如1981–2010、1988–2017),则温暖的咒语会大大减少。


 京公网安备 11010802027423号