当前位置:
X-MOL 学术
›
Diam. Relat. Mater.
›
论文详情
Our official English website, www.x-mol.net, welcomes your feedback! (Note: you will need to create a separate account there.)
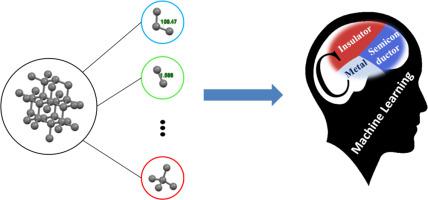
Electronic band structure phase diagram of 3D carbon allotropes from machine learning
Diamond and Related Materials ( IF 4.1 ) Pub Date : 2020-10-01 , DOI: 10.1016/j.diamond.2020.107990 Wei Wu , Sheng Gong , Qiang Sun
Diamond and Related Materials ( IF 4.1 ) Pub Date : 2020-10-01 , DOI: 10.1016/j.diamond.2020.107990 Wei Wu , Sheng Gong , Qiang Sun
|
Abstract The unique electronic configuration endows carbon with super-flexible bonding ability, displaying metallic, semi-conducting and insulating features with unprecedented applications. Inspired by the pressure–temperature phase diagram that clearly shows the phases (solid/liquid/gas) of a substance in different conditions, for the first time, we have derived the electronic ‘phase diagram’ using machine learning that can discover complex rules and invisible relationships among multi-variables. Based on SACADA database with 522 three-dimensional carbon allotropes, electronic band gap is studied by using support vector machine, decision tree and multiple-layer perception algorithms. It is identified that density and bond angle are two key factors in determining the electronic phase diagram for distinguishing metallic, semiconducting, and insulating carbon phases, where density relates to bond length and coordination number, while bond angle relates to orbital orientations, both together determine the overlap of wave functions between different orbitals.
中文翻译:

来自机器学习的 3D 碳同素异形体的电子能带结构相图
摘要 独特的电子配置赋予碳超柔韧的键合能力,展现出前所未有的金属、半导体和绝缘特性。受压力-温度相图的启发,该相图清楚地显示了物质在不同条件下的相(固/液/气),我们首次使用机器学习推导出了电子“相图”,它可以发现复杂的规则和多变量之间的无形关系。基于具有522个三维碳同素异形体的SACADA数据库,利用支持向量机、决策树和多层感知算法研究了电子带隙。确定密度和键角是确定电子相图以区分金属、半导体、
更新日期:2020-10-01
中文翻译:
来自机器学习的 3D 碳同素异形体的电子能带结构相图
摘要 独特的电子配置赋予碳超柔韧的键合能力,展现出前所未有的金属、半导体和绝缘特性。受压力-温度相图的启发,该相图清楚地显示了物质在不同条件下的相(固/液/气),我们首次使用机器学习推导出了电子“相图”,它可以发现复杂的规则和多变量之间的无形关系。基于具有522个三维碳同素异形体的SACADA数据库,利用支持向量机、决策树和多层感知算法研究了电子带隙。确定密度和键角是确定电子相图以区分金属、半导体、


 京公网安备 11010802027423号