当前位置:
X-MOL 学术
›
J. Chem. Eng. Data
›
论文详情
Our official English website, www.x-mol.net, welcomes your feedback! (Note: you will need to create a separate account there.)
Hydrate Stability in the H2S–H2O system—Visual Observations and Measurements in a High-Pressure Optical Cell and Thermodynamic Models
Journal of Chemical & Engineering Data ( IF 2.6 ) Pub Date : 2020-06-30 , DOI: 10.1021/acs.jced.0c00217 Jiyue Sun 1, 2 , Yang Xin 1, 2 , I−Ming Chou 1 , Rui Sun 3 , Lei Jiang 1
Journal of Chemical & Engineering Data ( IF 2.6 ) Pub Date : 2020-06-30 , DOI: 10.1021/acs.jced.0c00217 Jiyue Sun 1, 2 , Yang Xin 1, 2 , I−Ming Chou 1 , Rui Sun 3 , Lei Jiang 1
Affiliation
|
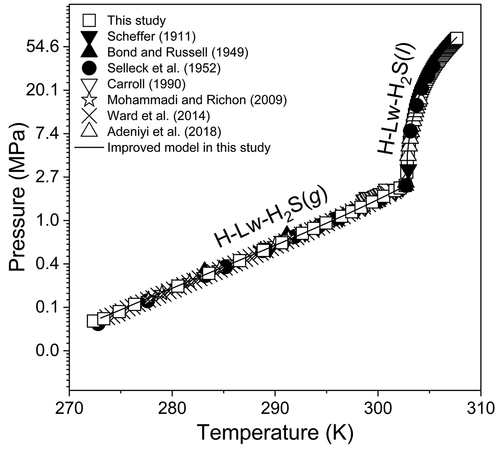
A visual method was developed to investigate the equilibrium phase relations of hydrate in the hydrogen sulfide (H2S)–H2O system using a high-pressure optical cell coupled with a heating–cooling stage under a microscope. The equilibrium pressure (P)–temperature (T) phase boundaries for the assemblages (1) hydrate (H)–liquid water (Lw)–vapor H2S [H2S (g)] and (2) H–Lw–liquid H2S [H2S (l)] were determined over a wide P–T range (0.0986 to 66.128 MPa and 272.4 to 307.7 K, respectively). In this study, a smaller visual cell was used, which has four advantages: (1) the phase transition process in a high-pressure optical cell under a microscope at various well–controlled P–T conditions can be fully observed; (2) the experimental run time is considerably reduced owing to the small experimental device, and <1 h is required to collect each equilibrium datum; (3) the experiment was sufficiently safe because the high-pressure optical cell contains a small amount of H2S; and (4) the high-pressure optical cell is suitable for studying sample fluids at temperatures up to 873.15 K and pressures up to 100 MPa; the measurement range of P and T being far beyond that of previous studies. The van der Waals–Platteeuw model was used to calculate the equilibrium P–T lines for these two three-phase assemblages. To achieve more accurate results, the Kihara potential parameters were optimized using the improved values of H2S fugacity and its solubility in pure water, calculated from high-quality thermodynamic models, and the experimental data measured in this and previous studies. The average absolute deviations of the new model from the experimental data of this study are 1.1% and 5.8% for the H–Lw–H2S (g) and H–Lw–H2S (l) phase boundaries, respectively.
中文翻译:

H 2 S–H 2 O系统中的水合物稳定性-高压光学电池和热力学模型中的视觉观察和测量
开发了一种可视化方法,使用高压光学电池和加热-冷却台在显微镜下研究硫化氢(H 2 S)-H 2 O系统中水合物的平衡相关系。组合(1)水合物(H)-液态水(Lw)-水蒸气H 2 S [H 2 S(g)]和(2)H–Lw–的平衡压力(P)-温度(T)相界。在较宽的PT范围内测定了液态H 2 S [H 2 S(l)]范围(分别为0.0986至66.128 MPa和272.4至307.7 K)。在这项研究中,使用了较小的视觉单元,它具有四个优点:(1)在显微镜下,在各种可控的P–T条件下,高压光学单元中的相变过程可以完全观察到;(2)由于实验装置小,实验运行时间大大减少,并且收集每个平衡数据需要<1 h;(3)由于高压光学电池中含有少量的H 2 S,因此实验是足够安全的;(4)高压光学元件适合于研究温度高达873.15 K,压力高达100 MPa的样品流体;P和T的测量范围远远超出了以前的研究。Van der Waals–Platteeuw模型用于计算这两个三相组合的平衡P–T线。为了获得更准确的结果,使用从高质量热力学模型计算出的H 2 S逸度及其在纯水中的溶解度的改进值和在本次研究及以前的研究中测得的实验数据,对Kihara势参数进行了优化。根据本研究的实验数据,新模型的平均绝对偏差在H–Lw–H 2 S(g)和H–Lw–H 2 S(l)相界处分别为1.1%和5.8%。
更新日期:2020-08-14
中文翻译:
H 2 S–H 2 O系统中的水合物稳定性-高压光学电池和热力学模型中的视觉观察和测量
开发了一种可视化方法,使用高压光学电池和加热-冷却台在显微镜下研究硫化氢(H 2 S)-H 2 O系统中水合物的平衡相关系。组合(1)水合物(H)-液态水(Lw)-水蒸气H 2 S [H 2 S(g)]和(2)H–Lw–的平衡压力(P)-温度(T)相界。在较宽的PT范围内测定了液态H 2 S [H 2 S(l)]范围(分别为0.0986至66.128 MPa和272.4至307.7 K)。在这项研究中,使用了较小的视觉单元,它具有四个优点:(1)在显微镜下,在各种可控的P–T条件下,高压光学单元中的相变过程可以完全观察到;(2)由于实验装置小,实验运行时间大大减少,并且收集每个平衡数据需要<1 h;(3)由于高压光学电池中含有少量的H 2 S,因此实验是足够安全的;(4)高压光学元件适合于研究温度高达873.15 K,压力高达100 MPa的样品流体;P和T的测量范围远远超出了以前的研究。Van der Waals–Platteeuw模型用于计算这两个三相组合的平衡P–T线。为了获得更准确的结果,使用从高质量热力学模型计算出的H 2 S逸度及其在纯水中的溶解度的改进值和在本次研究及以前的研究中测得的实验数据,对Kihara势参数进行了优化。根据本研究的实验数据,新模型的平均绝对偏差在H–Lw–H 2 S(g)和H–Lw–H 2 S(l)相界处分别为1.1%和5.8%。


 京公网安备 11010802027423号