Water Research ( IF 12.8 ) Pub Date : 2020-06-17 , DOI: 10.1016/j.watres.2020.116046 Cheng Fang 1 , Zahra Sobhani 2 , Xian Zhang 3 , Christopher T Gibson 4 , Youhong Tang 5 , Ravi Naidu 1
|
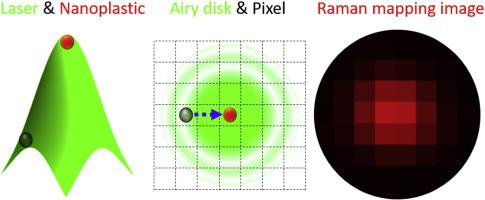
We recently reported (Sobhani et al., 2020) that when a confocal Raman microscope imaged a nanoplastic with the diameter of 100 nm, the imaging lateral size was 300–400 nm, due to the diffraction limit of the laser spot. In this study, we examine the lateral intensity distribution of the Raman signal emitted by nanoplastics (diameters ranging ∼30–600 nm) within the excitation laser spot. We find that the Raman emission intensity, similar to the excitation power density distributed within a laser spot, also follows a lateral Gaussian distribution. To image and visualise individual nanoplastics, we (i) decrease the mapping pixel size, in a hope to generate an image with high-resolution and simultaneously to pick up items from the “blind point”. We can then either (ii) offset the colour to intentionally image only the high-intensity portion of the Raman signal (emitted from the centre of the laser spot), to localise the exact position of the nanoplastic; or (iii) categorise the imaged nanoplastics to different groups via their Raman intensity, to simultaneously and separately visualise large nanoplastics/strong Raman signals, medium nanoplastics and small nanoplastics, in an effort to avoid the shielding and overlooking of weak signals. We (iv) also cross-check multi-images simultaneously mapped at two or three characteristic peaks via either a logic-OR or a logic-AND algorithm. Thus the imaging uncertainty can be significantly reduced from a statistical point of view.
中文翻译:
通过拉曼成像(ii)识别和可视化微塑料/纳米塑料:是否小于激光的衍射极限?
我们最近报道(Sobhani等,2020),当共聚焦拉曼显微镜对直径为100 nm的纳米塑料成像时,由于激光点的衍射极限,成像横向尺寸为300–400 nm。在这项研究中,我们研究了激发激光光斑内纳米塑料(直径范围约为30-600 nm)发出的拉曼信号的横向强度分布。我们发现,拉曼发射强度类似于激光光斑内分布的激发功率密度,也遵循横向高斯分布。为了成像和可视化单个纳米塑料,我们(i)减小了映射像素的大小,以期生成具有高分辨率的图像并同时从“盲点”拾取物品。然后,我们可以(ii)偏移颜色以有意仅对拉曼信号的高强度部分(从激光光斑的中心发射)成像,以定位纳米塑料的确切位置;或(iii)通过其成像的拉曼强度将成像的纳米塑料分为不同的组,以同时并分别可视化大的纳米塑料/强拉曼信号,中等的纳米塑料和小的纳米塑料,从而避免屏蔽和忽略微弱的信号。我们(iv)还通过逻辑或算法或逻辑与算法交叉检查同时映射到两个或三个特征峰的多图像。因此,从统计的角度来看,可以显着降低成像不确定性。或(iii)通过其成像的拉曼强度将成像的纳米塑料分为不同的组,以同时并分别可视化大的纳米塑料/强拉曼信号,中等的纳米塑料和小的纳米塑料,从而避免屏蔽和忽略微弱的信号。我们(iv)还通过逻辑或算法或逻辑与算法交叉检查同时映射到两个或三个特征峰的多图像。因此,从统计的角度来看,可以显着降低成像不确定性。或(iii)通过其成像的拉曼强度将成像的纳米塑料分为不同的组,以同时并分别可视化大的纳米塑料/强拉曼信号,中等的纳米塑料和小的纳米塑料,从而避免屏蔽和忽略微弱的信号。我们(iv)还通过逻辑或算法或逻辑与算法交叉检查同时映射到两个或三个特征峰的多图像。因此,从统计的角度来看,可以显着降低成像不确定性。我们(iv)还通过逻辑或算法或逻辑与算法交叉检查同时映射到两个或三个特征峰的多图像。因此,从统计的角度来看,可以显着降低成像不确定性。我们(iv)还通过逻辑或算法或逻辑与算法交叉检查同时映射到两个或三个特征峰的多图像。因此,从统计的角度来看,可以显着降低成像不确定性。


 京公网安备 11010802027423号