当前位置:
X-MOL 学术
›
Meteorol. Appl.
›
论文详情
Our official English website, www.x-mol.net, welcomes your feedback! (Note: you will need to create a separate account there.)
Spatiotemporal analysis of the relationship between near‐surface air temperature and troposphere thickness over Iran
Meteorological Applications ( IF 2.7 ) Pub Date : 2020-04-16 , DOI: 10.1002/met.1907 Mohammad Darand 1, 2
Meteorological Applications ( IF 2.7 ) Pub Date : 2020-04-16 , DOI: 10.1002/met.1907 Mohammad Darand 1, 2
Affiliation
|
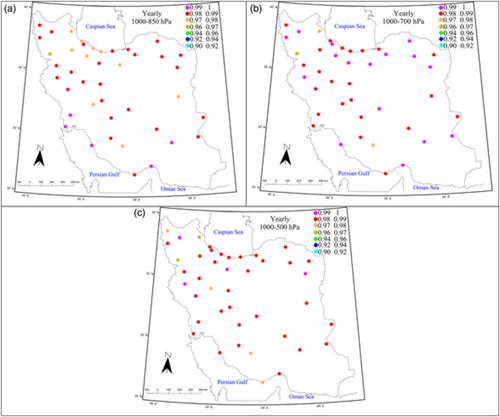
The correlation between the thickness of the troposphere (THK) and observed temperature over Iran is investigated. To achieve this goal, the monthly observed temperature data for the period between January 1, 1979 and December 31, 2013, from 42 meteorological stations throughout Iran were used. Atmospheric thickness, defined as the vertical distances between the 500, 700, 850 and 1,000 hPa pressure surfaces, is directly related to near‐surface air temperature. The results show that the magnitude of the correlation between near‐surface air temperature and the THK vary in different months and from region to region. The strongest significant correlation was observed between December and March when air temperature is low. The correlation was particularly high in the eastern part of the study area at layer 1,000–850 hPa, while the strongest correlation was observed at layer 1,000–700 hPa in the mountainous western parts of the country. The study area's average correlation co‐efficient in March fluctuated between 0.900 at layer 1,000–500 hPa to 0.918 at layer 1,000–700 hPa. The magnitude of the correlation co‐efficients and the spatial extent of the significant positive correlation gradually decreased with increasing air temperature, reaching a minimum during the summer. Low‐level troposphere thickness (1,000–700 hPa) plays an important role in impacting near‐surface temperature comparable with the effect of mid‐level troposphere thickness.
中文翻译:

伊朗近地表气温与对流层厚度关系的时空分析
研究了对流层厚度(THK)与伊朗上空观测温度之间的相关性。为了实现此目标,使用了1979年1月1日至2013年12月31日期间伊朗全境42个气象站的每月观测温度数据。大气厚度定义为500、700、850和1,000 hPa压力表面之间的垂直距离,直接与近地表空气温度有关。结果表明,近地表气温与THK之间的相关程度在不同月份和地区之间有所不同。在12月和3月之间,当气温低时,观察到最强的相关性。在研究区域的东部,在1,000–850 hPa层,相关性特别高,而在该国西部山区,在1000-700 hPa层观测到最强的相关性。3月份研究区域的平均相关系数在1000–500 hPa层的0.900至1,000–700 hPa层的0.918之间波动。随着空气温度的升高,相关系数的大小和显着正相关的空间范围逐渐减小,在夏季达到最低。与对流层中层厚度的影响相比,低层对流层厚度(1,000–700 hPa)在影响近地表温度方面起着重要作用。000–700 hPa。随着空气温度的升高,相关系数的大小和显着正相关的空间范围逐渐减小,在夏季达到最低。与中层对流层厚度的影响相比,低层对流层厚度(1,000–700 hPa)在影响近地表温度方面起着重要作用。000–700 hPa。随着空气温度的升高,相关系数的大小和显着正相关的空间范围逐渐减小,在夏季达到最低。与对流层中层厚度的影响相比,低层对流层厚度(1,000–700 hPa)在影响近地表温度方面起着重要作用。
更新日期:2020-04-16
中文翻译:
伊朗近地表气温与对流层厚度关系的时空分析
研究了对流层厚度(THK)与伊朗上空观测温度之间的相关性。为了实现此目标,使用了1979年1月1日至2013年12月31日期间伊朗全境42个气象站的每月观测温度数据。大气厚度定义为500、700、850和1,000 hPa压力表面之间的垂直距离,直接与近地表空气温度有关。结果表明,近地表气温与THK之间的相关程度在不同月份和地区之间有所不同。在12月和3月之间,当气温低时,观察到最强的相关性。在研究区域的东部,在1,000–850 hPa层,相关性特别高,而在该国西部山区,在1000-700 hPa层观测到最强的相关性。3月份研究区域的平均相关系数在1000–500 hPa层的0.900至1,000–700 hPa层的0.918之间波动。随着空气温度的升高,相关系数的大小和显着正相关的空间范围逐渐减小,在夏季达到最低。与对流层中层厚度的影响相比,低层对流层厚度(1,000–700 hPa)在影响近地表温度方面起着重要作用。000–700 hPa。随着空气温度的升高,相关系数的大小和显着正相关的空间范围逐渐减小,在夏季达到最低。与中层对流层厚度的影响相比,低层对流层厚度(1,000–700 hPa)在影响近地表温度方面起着重要作用。000–700 hPa。随着空气温度的升高,相关系数的大小和显着正相关的空间范围逐渐减小,在夏季达到最低。与对流层中层厚度的影响相比,低层对流层厚度(1,000–700 hPa)在影响近地表温度方面起着重要作用。


 京公网安备 11010802027423号