当前位置:
X-MOL 学术
›
Hydrol. Process.
›
论文详情
Our official English website, www.x-mol.net, welcomes your feedback! (Note: you will need to create a separate account there.)
Relationships between riparian evapotranspiration and groundwater depth along a semi‐arid irrigated river valley
Hydrological Processes ( IF 3.2 ) Pub Date : 2020-02-21 , DOI: 10.1002/hyp.13712 Matthew R. Lurtz 1 , Ryan R. Morrison 1 , Timothy K. Gates 1 , Gabriel B. Senay 2 , Aditi S. Bhaskar 1 , David G. Ketchum 3
Hydrological Processes ( IF 3.2 ) Pub Date : 2020-02-21 , DOI: 10.1002/hyp.13712 Matthew R. Lurtz 1 , Ryan R. Morrison 1 , Timothy K. Gates 1 , Gabriel B. Senay 2 , Aditi S. Bhaskar 1 , David G. Ketchum 3
Affiliation
|
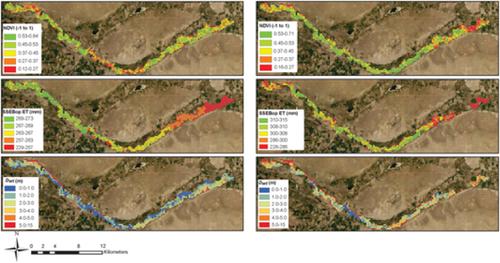
Evapotranspiration (ET) from riparian vegetation can be difficult to estimate due to relatively abundant water supply, spatial vegetation heterogeneity, and interactions with anthropogenic influences such as shallower groundwater tables, increased salinity, and nonpoint source pollution induced by irrigation. In semiarid south‐eastern Colorado, reliable ET estimates are scarce for the riparian corridor that borders the Arkansas River. This work investigates relationships between the riparian ecosystem along the Arkansas River and an underlying alluvial aquifer using ET estimates from remotely sensed data and modelled water table depths. Results from a calibrated, finite‐difference groundwater model are used to estimate weekly water table fluctuations in the riparian ecosystem from 1999 to 2009, and estimates of ET are calculated using the Operational Simplified Surface Energy Balance (SSEBop) model with over 200 Landsat scenes covering over 30 km² of riparian ecosystem along a 70‐km stretch of the river. Comparison of calculated monthly SSEBop ET to estimated alfalfa reference ET from local micrometeorological station data indicated statistically significant high linear correspondence (R² = .87). Daily calculated SSEBop ET showed statistically significant moderate linear correspondence with data from a local weighing lysimeter (R² = .59). Simulated monthly SSEBop ET values were larger in drier years compared with wetter years, and ET variability was also larger in drier years. Peak ET most commonly occurred during the month of June for all 11 years of analysis. Relationships between ET and water table depth showed that peak monthly ET was highest when groundwater depths were less than about 3 m, and ET values were significantly lower for groundwater depths greater than 3 m. Negative sample Spearman correlation highlighted riparian corridor locations where ET increased as a result of decreased groundwater depths across years with different hydroclimatic conditions. This study shows how a combination of remotely sensed riparian ET estimates and a regional groundwater model can improve our understanding of linkages between riparian consumptive use and near‐river groundwater conditions influenced by irrigation return flow and different climatic drivers.
中文翻译:

半干旱灌溉河谷沿岸蒸发量与地下水深度的关系
由于相对丰富的供水、空间植被异质性以及与人为影响的相互作用,例如较浅的地下水位、盐度增加和灌溉引起的非点源污染,河岸植被的蒸散量 (ET) 可能难以估计。在半干旱的科罗拉多州东南部,与阿肯色河接壤的河岸走廊缺乏可靠的 ET 估计值。这项工作使用来自遥感数据和模拟地下水位深度的 ET 估计,调查了阿肯色河沿岸的河岸生态系统与底层冲积含水层之间的关系。校准的有限差分地下水模型的结果用于估计 1999 年至 2009 年河岸生态系统中每周的地下水位波动,ET 的估计值是使用操作简化表面能量平衡 (SSEBop) 模型计算的,该模型有 200 多个 Landsat 场景,覆盖了 70 公里长的河流沿岸超过 30 平方公里的河岸生态系统。计算的每月 SSEBop ET 与来自当地微气象站数据的估计苜蓿参考 ET 的比较表明具有统计学意义的高线性对应 (R² = .87)。每日计算的 SSEBop ET 与本地称重蒸渗仪的数据显示出统计学上显着的中等线性对应关系 (R² = .59)。与湿润年份相比,干燥年份的模拟月 SSEBop ET 值更大,并且干旱年份的 ET 变异性也更大。在所有 11 年的分析中,ET 峰值最常发生在 6 月份。ET与地下水位深度的关系表明,当地下水深度小于3 m时,月ET峰值最高,大于3 m的地下水ET值显着降低。负样本 Spearman 相关性突出显示了河岸走廊位置,在不同水文气候条件下,由于地下水深度下降而导致 ET 增加。本研究展示了遥感河岸 ET 估计值和区域地下水模型的结合如何提高我们对河岸消耗性使用与受灌溉回流和不同气候驱动因素影响的近河地下水条件之间联系的理解。负样本 Spearman 相关性突出显示了河岸走廊位置,在不同水文气候条件下,由于地下水深度下降而导致 ET 增加。本研究展示了遥感河岸 ET 估计值和区域地下水模型的结合如何提高我们对河岸消耗性使用与受灌溉回流和不同气候驱动因素影响的近河地下水条件之间联系的理解。负样本 Spearman 相关性突出显示了河岸走廊位置,在不同水文气候条件下,由于地下水深度下降而导致 ET 增加。本研究展示了遥感河岸 ET 估计值和区域地下水模型的结合如何提高我们对河岸消耗性使用与受灌溉回流和不同气候驱动因素影响的近河地下水条件之间联系的理解。
更新日期:2020-02-21
中文翻译:
半干旱灌溉河谷沿岸蒸发量与地下水深度的关系
由于相对丰富的供水、空间植被异质性以及与人为影响的相互作用,例如较浅的地下水位、盐度增加和灌溉引起的非点源污染,河岸植被的蒸散量 (ET) 可能难以估计。在半干旱的科罗拉多州东南部,与阿肯色河接壤的河岸走廊缺乏可靠的 ET 估计值。这项工作使用来自遥感数据和模拟地下水位深度的 ET 估计,调查了阿肯色河沿岸的河岸生态系统与底层冲积含水层之间的关系。校准的有限差分地下水模型的结果用于估计 1999 年至 2009 年河岸生态系统中每周的地下水位波动,ET 的估计值是使用操作简化表面能量平衡 (SSEBop) 模型计算的,该模型有 200 多个 Landsat 场景,覆盖了 70 公里长的河流沿岸超过 30 平方公里的河岸生态系统。计算的每月 SSEBop ET 与来自当地微气象站数据的估计苜蓿参考 ET 的比较表明具有统计学意义的高线性对应 (R² = .87)。每日计算的 SSEBop ET 与本地称重蒸渗仪的数据显示出统计学上显着的中等线性对应关系 (R² = .59)。与湿润年份相比,干燥年份的模拟月 SSEBop ET 值更大,并且干旱年份的 ET 变异性也更大。在所有 11 年的分析中,ET 峰值最常发生在 6 月份。ET与地下水位深度的关系表明,当地下水深度小于3 m时,月ET峰值最高,大于3 m的地下水ET值显着降低。负样本 Spearman 相关性突出显示了河岸走廊位置,在不同水文气候条件下,由于地下水深度下降而导致 ET 增加。本研究展示了遥感河岸 ET 估计值和区域地下水模型的结合如何提高我们对河岸消耗性使用与受灌溉回流和不同气候驱动因素影响的近河地下水条件之间联系的理解。负样本 Spearman 相关性突出显示了河岸走廊位置,在不同水文气候条件下,由于地下水深度下降而导致 ET 增加。本研究展示了遥感河岸 ET 估计值和区域地下水模型的结合如何提高我们对河岸消耗性使用与受灌溉回流和不同气候驱动因素影响的近河地下水条件之间联系的理解。负样本 Spearman 相关性突出显示了河岸走廊位置,在不同水文气候条件下,由于地下水深度下降而导致 ET 增加。本研究展示了遥感河岸 ET 估计值和区域地下水模型的结合如何提高我们对河岸消耗性使用与受灌溉回流和不同气候驱动因素影响的近河地下水条件之间联系的理解。


 京公网安备 11010802027423号