当前位置:
X-MOL 学术
›
J. Anal. At. Spectrom.
›
论文详情
Our official English website, www.x-mol.net, welcomes your feedback! (Note: you will need to create a separate account there.)
Laser-induced breakdown spectroscopy (LIBS) spectra interpretation and characterization using parallel factor analysis (PARAFAC): a new procedure for data and spectral interference processing fostering the waste electrical and electronic equipment (WEEE) recycling process
Journal of Analytical Atomic Spectrometry ( IF 3.4 ) Pub Date : 2020-03-24 , DOI: 10.1039/d0ja00026d Jeyne Pricylla Castro 1, 2, 3, 4, 5 , Edenir Rodrigues Pereira-Filho 5, 6, 7, 8, 9 , Rasmus Bro 1, 2, 3, 4
Journal of Analytical Atomic Spectrometry ( IF 3.4 ) Pub Date : 2020-03-24 , DOI: 10.1039/d0ja00026d Jeyne Pricylla Castro 1, 2, 3, 4, 5 , Edenir Rodrigues Pereira-Filho 5, 6, 7, 8, 9 , Rasmus Bro 1, 2, 3, 4
Affiliation
|
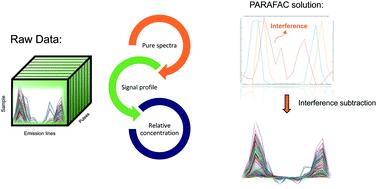
Laser-induced breakdown spectroscopy (LIBS) was used to characterize base (Al and Cu) and noble (Au and Ag) elements on a printed circuit board (PCB) from a hard disk (HD). A PCB was cut into 77 fragments, and a matrix of 4 rows and 4 columns with 10 laser pulses in each point of the matrix was acquired in each fragment by LIBS. For each element, a spectral range was selected with its respective emission lines and Parallel Factor Analysis (PARAFAC) was used to model the data. LIBS spectra are two-way data, but in this case, the depths were used as a third mode being the data set: samples × variables (emission lines) × depths (laser pulses from 1 to 10). PARAFAC was able to model spectral interference and analyte emission lines in separate components, which allows the removal of the contribution of the concomitants from the measured data. The scores (relative concentrations, mode 1) of the component of interest were used to create a map of the PCB colored by relative concentration, and it was possible to visualize where the element is predominantly located on the PCB. In addition, classification models were applied for Au and Ag using partial least squares discriminant analysis (PLSDA) after removal of the interferents using the PARAFAC result. Good figures of merit were obtained for calibration, cross-validation and validation data sets with accuracy ranging from 0.94 to 1.00. Therefore, the use of PARAFAC and LIBS spectra was very useful, being a great contribution to the LIBS community and urban mining.
中文翻译:

激光诱导击穿光谱(LIBS)光谱解释和表征,使用并行因子分析(PARAFAC):数据和光谱干扰处理的新程序,促进了废弃电子电气设备(WEEE)的回收过程
激光诱导击穿光谱法(LIBS)用于表征硬盘(HD)在印刷电路板(PCB)上的碱(铝和铜)和贵金属(金和银)元素。将PCB切成77个碎片,并通过LIBS在每个碎片中获取一个4行4列的矩阵,矩阵的每个点均具有10个激光脉冲。对于每个元素,选择光谱范围及其相应的发射谱线,并使用并行因子分析(PARAFAC)对数据进行建模。LIBS光谱是双向数据,但在这种情况下,深度用作数据集的第三种模式:样本×变量(发射线)×深度(1到10的激光脉冲)。PARAFAC能够对单独组件中的光谱干扰线和分析物发射线进行建模,从而可以从测量数据中消除伴随物的影响。感兴趣的组件的分数(相对浓度,模式1)用于创建通过相对浓度着色的PCB的图,并且可以可视化元素在PCB上的主要位置。此外,在使用PARAFAC结果去除干扰物后,使用偏最小二乘判别分析(PLSDA)将分类模型应用于Au和Ag。获得了用于校准,交叉验证和验证数据集的良好品质因数,准确度范围为0.94至1.00。因此,PARAFAC和LIBS光谱的使用非常有用,为LIBS社区和城市采矿做出了巨大贡献。并且可以可视化元素在PCB上的主要位置。此外,使用PARAFAC结果去除干扰物后,使用偏最小二乘判别分析(PLSDA)将分类模型应用于Au和Ag。获得了用于校准,交叉验证和验证数据集的良好品质因数,准确度范围为0.94至1.00。因此,PARAFAC和LIBS光谱的使用非常有用,为LIBS社区和城市采矿做出了巨大贡献。并且可以可视化元素在PCB上的主要位置。此外,在使用PARAFAC结果去除干扰物后,使用偏最小二乘判别分析(PLSDA)将分类模型应用于Au和Ag。获得了用于校准,交叉验证和验证数据集的良好品质因数,准确度范围为0.94至1.00。因此,PARAFAC和LIBS光谱的使用非常有用,为LIBS社区和城市采矿做出了巨大贡献。交叉验证和验证数据集,准确度范围从0.94到1.00。因此,PARAFAC和LIBS光谱的使用非常有用,为LIBS社区和城市采矿做出了巨大贡献。交叉验证和验证数据集,准确度范围从0.94到1.00。因此,PARAFAC和LIBS光谱的使用非常有用,为LIBS社区和城市采矿做出了巨大贡献。
更新日期:2020-03-24
中文翻译:
激光诱导击穿光谱(LIBS)光谱解释和表征,使用并行因子分析(PARAFAC):数据和光谱干扰处理的新程序,促进了废弃电子电气设备(WEEE)的回收过程
激光诱导击穿光谱法(LIBS)用于表征硬盘(HD)在印刷电路板(PCB)上的碱(铝和铜)和贵金属(金和银)元素。将PCB切成77个碎片,并通过LIBS在每个碎片中获取一个4行4列的矩阵,矩阵的每个点均具有10个激光脉冲。对于每个元素,选择光谱范围及其相应的发射谱线,并使用并行因子分析(PARAFAC)对数据进行建模。LIBS光谱是双向数据,但在这种情况下,深度用作数据集的第三种模式:样本×变量(发射线)×深度(1到10的激光脉冲)。PARAFAC能够对单独组件中的光谱干扰线和分析物发射线进行建模,从而可以从测量数据中消除伴随物的影响。感兴趣的组件的分数(相对浓度,模式1)用于创建通过相对浓度着色的PCB的图,并且可以可视化元素在PCB上的主要位置。此外,在使用PARAFAC结果去除干扰物后,使用偏最小二乘判别分析(PLSDA)将分类模型应用于Au和Ag。获得了用于校准,交叉验证和验证数据集的良好品质因数,准确度范围为0.94至1.00。因此,PARAFAC和LIBS光谱的使用非常有用,为LIBS社区和城市采矿做出了巨大贡献。并且可以可视化元素在PCB上的主要位置。此外,使用PARAFAC结果去除干扰物后,使用偏最小二乘判别分析(PLSDA)将分类模型应用于Au和Ag。获得了用于校准,交叉验证和验证数据集的良好品质因数,准确度范围为0.94至1.00。因此,PARAFAC和LIBS光谱的使用非常有用,为LIBS社区和城市采矿做出了巨大贡献。并且可以可视化元素在PCB上的主要位置。此外,在使用PARAFAC结果去除干扰物后,使用偏最小二乘判别分析(PLSDA)将分类模型应用于Au和Ag。获得了用于校准,交叉验证和验证数据集的良好品质因数,准确度范围为0.94至1.00。因此,PARAFAC和LIBS光谱的使用非常有用,为LIBS社区和城市采矿做出了巨大贡献。交叉验证和验证数据集,准确度范围从0.94到1.00。因此,PARAFAC和LIBS光谱的使用非常有用,为LIBS社区和城市采矿做出了巨大贡献。交叉验证和验证数据集,准确度范围从0.94到1.00。因此,PARAFAC和LIBS光谱的使用非常有用,为LIBS社区和城市采矿做出了巨大贡献。


 京公网安备 11010802027423号