Journal of Pharmaceutical Analysis ( IF 8.8 ) Pub Date : 2020-03-06 , DOI: 10.1016/j.jpha.2020.03.004 Cong Shen 1 , Nan Yu 2 , Shubo Cai 3 , Jie Zhou 3 , Jiexin Sheng 4 , Kang Liu 5 , Heping Zhou 6 , Youmin Guo 1 , Gang Niu 1
|
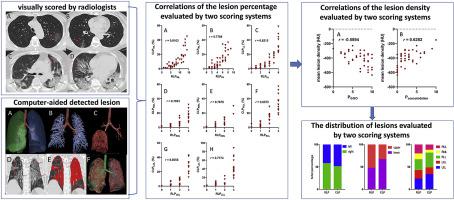
To examine the feasibility of using a computer tool for stratifying the severity of Coronavirus Disease 2019 (COVID-19) based on computed tomography (CT) images. We retrospectively examined 44 confirmed COVID-19 cases. All cases were evaluated separately by radiologists (visually) and through an in-house computer software. The degree of lesions was visually scored by the radiologist, as follows, for each of the 5 lung lobes: 0, no lesion present; 1, <1/3 involvement; 2, >1/3 and < 2/3 involvement; and 3, >2/3 involvement. Lesion density was assessed based on the proportion of ground-glass opacity (GGO), consolidation and fibrosis of the lesions. The parameters obtained using the computer tool included lung volume (mL), lesion volume (mL), lesion percentage (%), and mean lesion density (HU) of the whole lung, right lung, left lung, and each lobe. The scores obtained by the radiologists and quantitative results generated by the computer software were tested for correlation. A Chi-square test was used to test the consistency of radiologist- and computer-derived lesion percentage in the right/left lung, upper/lower lobe, and each of the 5 lobes. The results showed a strong to moderate correlation between lesion percentage scores obtained by radiologists and the computer software (r ranged from 0.7679 to 0.8373, P < 0.05), and a moderate correlation between the proportion of GGO and mean lesion density (r = −0.5894, P < 0.05), and proportion of consolidation and mean lesion density (r = 0.6282, P < 0.05). Computer-aided quantification showed a statistical significant higher lesion percentage for lower lobes than that assessed by the radiologists (χ2 = 8.160, P = 0.004). Our experiments demonstrated that the computer tool could reliably and accurately assess the severity and distribution of pneumonia on CT scans.
中文翻译:
定量计算机断层扫描分析,用于对2019年冠状病毒疾病的严重性进行分层。
根据计算机断层扫描(CT)图像检查使用计算机工具对2019年冠状病毒病(COVID-19)严重程度进行分层的可行性。我们回顾性检查了44例确诊的COVID-19病例。所有病例均由放射科医生单独(通过视觉)并通过内部计算机软件进行评估。对于5个肺叶中的每一个,放射科医生目视对病变的程度进行评分,如下:0,不存在病变; 0,不存在病变。1,<1/3参与; 2,参与度> 1/3和<2/3; 3,> 2/3参与。根据毛玻璃样混浊(GGO),病变的巩固和纤维化的比例评估病变密度。使用计算机工具获得的参数包括全肺,右肺,左肺,肺,肺,肺,肺,和每个瓣。对放射线医师获得的分数和计算机软件产生的定量结果进行相关性测试。卡方检验用于检验右/左肺,上/下肺叶以及5个肺叶中每个放射科医师和计算机病变的百分比的一致性。结果显示,放射科医生和计算机软件获得的病变百分率得分之间存在强至中等的相关性(r的范围为0.7679至0.8373,P <0.05),并且GGO的比例和平均病变密度之间的相关性适中(r = -0.5894,P <0.05)以及巩固和平均病变密度的比例之间的相关性(r = 0.6282,P <0.05)。计算机辅助定量表明为比由放射科医师评估下叶的统计显著更高病变百分比(χ 2 = 8.160,P = 0.004)。我们的实验表明,该计算机工具可以可靠,准确地评估CT扫描中肺炎的严重程度和分布。


 京公网安备 11010802027423号