Our official English website, www.x-mol.net, welcomes your feedback! (Note: you will need to create a separate account there.)
US Health Care Spending by Payer and Health Condition, 1996-2016
JAMA ( IF 120.7 ) Pub Date : 2020-03-03 , DOI: 10.1001/jama.2020.0734 Joseph L Dieleman 1 , Jackie Cao 1 , Abby Chapin 1 , Carina Chen 1 , Zhiyin Li 1 , Angela Liu 1 , Cody Horst 1 , Alexander Kaldjian 1 , Taylor Matyasz 1 , Kirstin Woody Scott 2 , Anthony L Bui 3 , Madeline Campbell 4 , Herbert C Duber 1, 5 , Abe C Dunn 6 , Abraham D Flaxman 1 , Christina Fitzmaurice 1, 7 , Mohsen Naghavi 1 , Nafis Sadat 8 , Peter Shieh 6 , Ellen Squires 9 , Kai Yeung 10 , Christopher J L Murray 1
JAMA ( IF 120.7 ) Pub Date : 2020-03-03 , DOI: 10.1001/jama.2020.0734 Joseph L Dieleman 1 , Jackie Cao 1 , Abby Chapin 1 , Carina Chen 1 , Zhiyin Li 1 , Angela Liu 1 , Cody Horst 1 , Alexander Kaldjian 1 , Taylor Matyasz 1 , Kirstin Woody Scott 2 , Anthony L Bui 3 , Madeline Campbell 4 , Herbert C Duber 1, 5 , Abe C Dunn 6 , Abraham D Flaxman 1 , Christina Fitzmaurice 1, 7 , Mohsen Naghavi 1 , Nafis Sadat 8 , Peter Shieh 6 , Ellen Squires 9 , Kai Yeung 10 , Christopher J L Murray 1
Affiliation
|
Importance
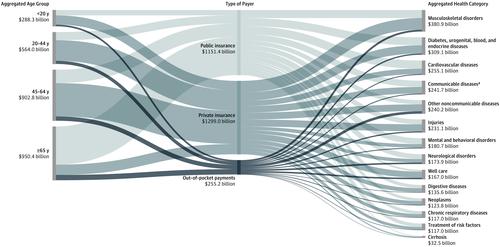
US health care spending has continued to increase and now accounts for 18% of the US economy, although little is known about how spending on each health condition varies by payer, and how these amounts have changed over time. Objective
To estimate US spending on health care according to 3 types of payers (public insurance [including Medicare, Medicaid, and other government programs], private insurance, or out-of-pocket payments) and by health condition, age group, sex, and type of care for 1996 through 2016. Design and Setting
Government budgets, insurance claims, facility records, household surveys, and official US records from 1996 through 2016 were collected to estimate spending for 154 health conditions. Spending growth rates (standardized by population size and age group) were calculated for each type of payer and health condition. Exposures
Ambulatory care, inpatient care, nursing care facility stay, emergency department care, dental care, and purchase of prescribed pharmaceuticals in a retail setting. Main Outcomes and Measures
National spending estimates stratified by health condition, age group, sex, type of care, and type of payer and modeled for each year from 1996 through 2016. Results
Total health care spending increased from an estimated $1.4 trillion in 1996 (13.3% of gross domestic product [GDP]; $5259 per person) to an estimated $3.1 trillion in 2016 (17.9% of GDP; $9655 per person); 85.2% of that spending was included in this study. In 2016, an estimated 48.0% (95% CI, 48.0%-48.0%) of health care spending was paid by private insurance, 42.6% (95% CI, 42.5%-42.6%) by public insurance, and 9.4% (95% CI, 9.4%-9.4%) by out-of-pocket payments. In 2016, among the 154 conditions, low back and neck pain had the highest amount of health care spending with an estimated $134.5 billion (95% CI, $122.4-$146.9 billion) in spending, of which 57.2% (95% CI, 52.2%-61.2%) was paid by private insurance, 33.7% (95% CI, 30.0%-38.4%) by public insurance, and 9.2% (95% CI, 8.3%-10.4%) by out-of-pocket payments. Other musculoskeletal disorders accounted for the second highest amount of health care spending (estimated at $129.8 billion [95% CI, $116.3-$149.7 billion]) and most had private insurance (56.4% [95% CI, 52.6%-59.3%]). Diabetes accounted for the third highest amount of the health care spending (estimated at $111.2 billion [95% CI, $105.7-$115.9 billion]) and most had public insurance (49.8% [95% CI, 44.4%-56.0%]). Other conditions estimated to have substantial health care spending in 2016 were ischemic heart disease ($89.3 billion [95% CI, $81.1-$95.5 billion]), falls ($87.4 billion [95% CI, $75.0-$100.1 billion]), urinary diseases ($86.0 billion [95% CI, $76.3-$95.9 billion]), skin and subcutaneous diseases ($85.0 billion [95% CI, $80.5-$90.2 billion]), osteoarthritis ($80.0 billion [95% CI, $72.2-$86.1 billion]), dementias ($79.2 billion [95% CI, $67.6-$90.8 billion]), and hypertension ($79.0 billion [95% CI, $72.6-$86.8 billion]). The conditions with the highest spending varied by type of payer, age, sex, type of care, and year. After adjusting for changes in inflation, population size, and age groups, public insurance spending was estimated to have increased at an annualized rate of 2.9% (95% CI, 2.9%-2.9%); private insurance, 2.6% (95% CI, 2.6%-2.6%); and out-of-pocket payments, 1.1% (95% CI, 1.0%-1.1%). Conclusions and Relevance
Estimates of US spending on health care showed substantial increases from 1996 through 2016, with the highest increases in population-adjusted spending by public insurance. Although spending on low back and neck pain, other musculoskeletal disorders, and diabetes accounted for the highest amounts of spending, the payers and the rates of change in annual spending growth rates varied considerably.
中文翻译:

1996-2016 年按付款人和健康状况划分的美国医疗保健支出
重要性 美国医疗保健支出持续增加,目前占美国经济的 18%,尽管人们对每种健康状况的支出如何因付款人而异,以及这些金额如何随时间变化而知之甚少。目标 根据 3 类支付者(公共保险 [包括医疗保险、医疗补助和其他政府计划]、私人保险或自付费用)以及健康状况、年龄组、性别、和 1996 年至 2016 年的护理类型。收集了 1996 年至 2016 年的政府预算、保险索赔、设施记录、家庭调查和美国官方记录,以估计 154 种健康状况的支出。针对每种类型的付款人和健康状况计算支出增长率(按人口规模和年龄组进行标准化)。暴露 门诊护理、住院护理、护理机构住宿、急诊科护理、牙科护理以及在零售环境中购买处方药。主要结果和措施 按健康状况、年龄组、性别、护理类型和付款人类型分层并建模的国家支出估计数从 1996 年到 2016 年。结果 总医疗保健支出从 1996 年估计的 1.4 万亿美元(13.3占国内生产总值 [GDP] 的百分比;每人 5259 美元)到 2016 年估计为 3.1 万亿美元(占 GDP 的 17.9%;每人 9655 美元);85.2% 的支出包含在这项研究中。2016 年,估计 48.0%(95% CI,48.0%-48.0%)的医疗保健支出由私人保险支付,42.6%(95% CI,42.5%-42.6%)由公共保险支付,9.4%(95 % CI,9.4%-9.4%)通过自付费用。2016 年,在 154 种疾病中,腰背痛和颈部疼痛的医疗保健支出最高,估计为 1345 亿美元(95% CI,122.4-1469 亿美元),其中 57.2%(95% CI,52.2%-61.2%) ) 由私人保险支付,33.7% (95% CI, 30.0%-38.4%) 由公共保险支付,9.2% (95% CI, 8.3%-10.4%) 由自费支付。其他肌肉骨骼疾病占医疗保健支出的第二大金额(估计为 1298 亿美元 [95% CI,116.3-1497 亿美元]),大多数都有私人保险(56.4% [95% CI,52.6%-59.3%])。糖尿病占医疗保健支出的第三大金额(估计为 1112 亿美元 [95% CI,105.7-1159 亿美元])并且大多数都有公共保险(49.8% [95% CI,44.4%-56.0%])。2016 年估计有大量医疗保健支出的其他疾病包括缺血性心脏病(893 亿美元 [95% CI,81.1-955 亿美元]),跌倒(874 亿美元 [95% CI,75.0-1001 亿美元]),泌尿系统疾病(86.0 美元) 10 亿美元 [95% CI,76.3-959 亿美元]),皮肤和皮下疾病(850 亿美元 [95% CI,80.5-902 亿美元]),骨关节炎(800 亿美元 [95% CI,72.2-861 亿美元]),痴呆症( 792 亿美元 [95% CI,67.6-908 亿美元])和高血压(790 亿美元 [95% CI,72.6-868 亿美元])。支出最高的条件因付款人类型、年龄、性别、护理类型和年份而异。在调整通货膨胀、人口规模和年龄组的变化后,公共保险支出估计以年化 2.9% 的速度增长(95% CI,2.9%-2.9%);私人保险,2.6%(95% CI,2.6%-2.6%);和自付费用,1.1%(95% CI,1.0%-1.1%)。结论和相关性 美国在医疗保健方面的支出从 1996 年到 2016 年大幅增加,其中公共保险的人口调整支出增幅最大。尽管腰背和颈部疼痛、其他肌肉骨骼疾病和糖尿病的支出最高,但支付者和年支出增长率的变化率差异很大。
更新日期:2020-03-03
中文翻译:
1996-2016 年按付款人和健康状况划分的美国医疗保健支出
重要性 美国医疗保健支出持续增加,目前占美国经济的 18%,尽管人们对每种健康状况的支出如何因付款人而异,以及这些金额如何随时间变化而知之甚少。目标 根据 3 类支付者(公共保险 [包括医疗保险、医疗补助和其他政府计划]、私人保险或自付费用)以及健康状况、年龄组、性别、和 1996 年至 2016 年的护理类型。收集了 1996 年至 2016 年的政府预算、保险索赔、设施记录、家庭调查和美国官方记录,以估计 154 种健康状况的支出。针对每种类型的付款人和健康状况计算支出增长率(按人口规模和年龄组进行标准化)。暴露 门诊护理、住院护理、护理机构住宿、急诊科护理、牙科护理以及在零售环境中购买处方药。主要结果和措施 按健康状况、年龄组、性别、护理类型和付款人类型分层并建模的国家支出估计数从 1996 年到 2016 年。结果 总医疗保健支出从 1996 年估计的 1.4 万亿美元(13.3占国内生产总值 [GDP] 的百分比;每人 5259 美元)到 2016 年估计为 3.1 万亿美元(占 GDP 的 17.9%;每人 9655 美元);85.2% 的支出包含在这项研究中。2016 年,估计 48.0%(95% CI,48.0%-48.0%)的医疗保健支出由私人保险支付,42.6%(95% CI,42.5%-42.6%)由公共保险支付,9.4%(95 % CI,9.4%-9.4%)通过自付费用。2016 年,在 154 种疾病中,腰背痛和颈部疼痛的医疗保健支出最高,估计为 1345 亿美元(95% CI,122.4-1469 亿美元),其中 57.2%(95% CI,52.2%-61.2%) ) 由私人保险支付,33.7% (95% CI, 30.0%-38.4%) 由公共保险支付,9.2% (95% CI, 8.3%-10.4%) 由自费支付。其他肌肉骨骼疾病占医疗保健支出的第二大金额(估计为 1298 亿美元 [95% CI,116.3-1497 亿美元]),大多数都有私人保险(56.4% [95% CI,52.6%-59.3%])。糖尿病占医疗保健支出的第三大金额(估计为 1112 亿美元 [95% CI,105.7-1159 亿美元])并且大多数都有公共保险(49.8% [95% CI,44.4%-56.0%])。2016 年估计有大量医疗保健支出的其他疾病包括缺血性心脏病(893 亿美元 [95% CI,81.1-955 亿美元]),跌倒(874 亿美元 [95% CI,75.0-1001 亿美元]),泌尿系统疾病(86.0 美元) 10 亿美元 [95% CI,76.3-959 亿美元]),皮肤和皮下疾病(850 亿美元 [95% CI,80.5-902 亿美元]),骨关节炎(800 亿美元 [95% CI,72.2-861 亿美元]),痴呆症( 792 亿美元 [95% CI,67.6-908 亿美元])和高血压(790 亿美元 [95% CI,72.6-868 亿美元])。支出最高的条件因付款人类型、年龄、性别、护理类型和年份而异。在调整通货膨胀、人口规模和年龄组的变化后,公共保险支出估计以年化 2.9% 的速度增长(95% CI,2.9%-2.9%);私人保险,2.6%(95% CI,2.6%-2.6%);和自付费用,1.1%(95% CI,1.0%-1.1%)。结论和相关性 美国在医疗保健方面的支出从 1996 年到 2016 年大幅增加,其中公共保险的人口调整支出增幅最大。尽管腰背和颈部疼痛、其他肌肉骨骼疾病和糖尿病的支出最高,但支付者和年支出增长率的变化率差异很大。


 京公网安备 11010802027423号