祝贺郭念坤的论文"S-Block Potassium Single-atom Electrocatalyst with K-N4 Configuration Derived from K+/Polydopamine for Efficient Oxygen Reduction" 发表在Angew. Chem. Int. Ed。(DOI: 10.1002/anie.202312409)
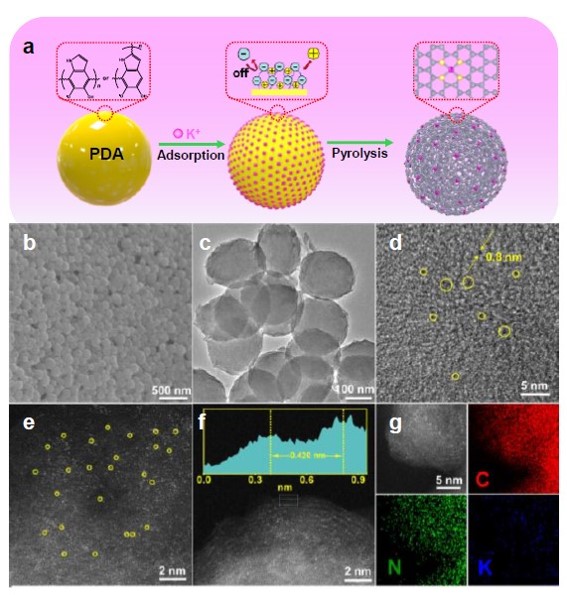
Figure 1. a) Schematic representation of the synthesis of K-N-C, b) SEM images of PDA, c, d) TEM images of K-N-C, e, f) ACHAADF- STEM image of K-N-C, g) Corresponding elemental mapping of K-N-C.
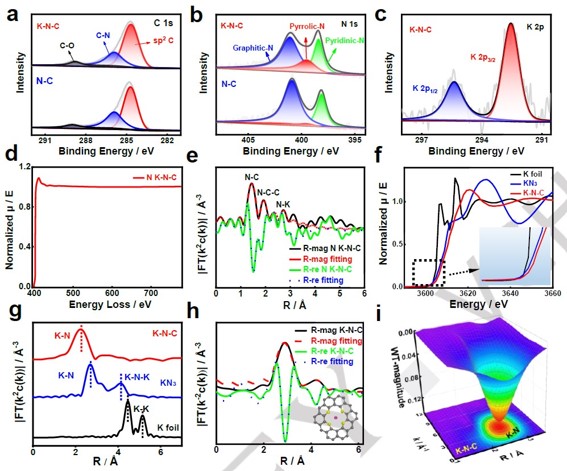
Figure 2. High-resolution XPS spectra: a) C 1s, b) N 1s, c) K 2p, d) The EELS diagram of N elements in K-N-C, e) χ(R) space spectra fitting curve of N K-edge of K-N-C, f) K K-edge XANE spectra, g) k3-weighted Fourier transforms, h) χ(R) space spectra fitting curve of K K-edge of K-N-C, i) WT-EXAFS plots of K-N-C.
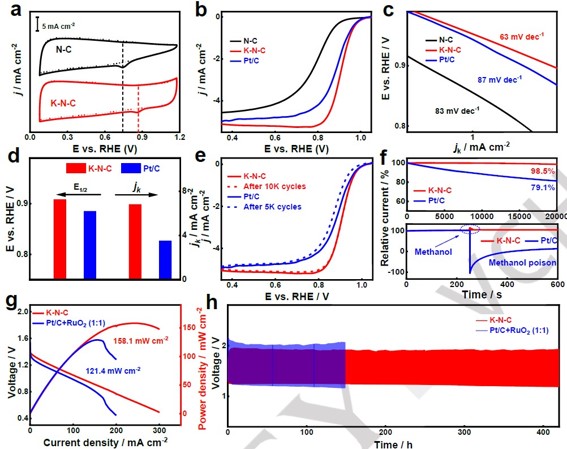
Figure 3. a) CV curves of N-C and K-N-C in with N2 (dashed line) or O2 (solid line), b) ORR polarization curves of N-C, K-N-C, and Pt/C electrocatalysts, c) Corresponding Tafel plots, d) Corresponding E1/2 and Jk (E=0.90 V) values, e) Stability test, f) Chrono amperoometric measurements at 0.7 V vs. RHE and Methanol crossover effect test of K-N-C and Pt/C, g) Power density, h) Long-term cycling performance at 5 mA cm-2 for 420 h.
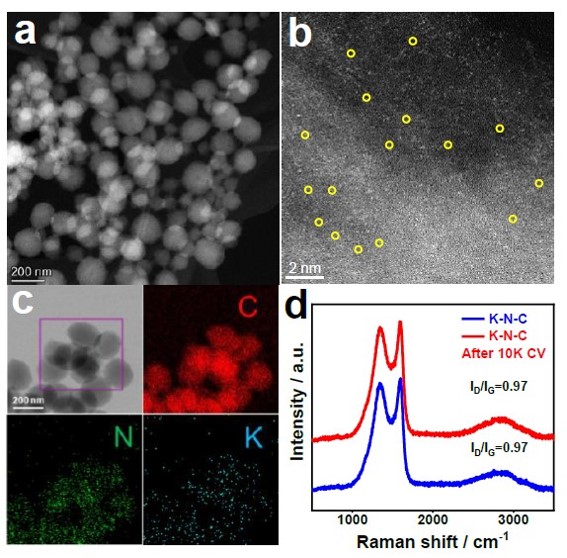
Figure 4. a, b) HAADF and AC-HAADF-STEM images, c) Corresponding element mapping, and d) Raman spectras of KN-C catalysts after 10,000 CV cycles.

Figure 5. a) The ORR reaction pathway and adsorption structure of *OOH, *O, and *OH on the K-N-C catalyst, b) Free energy diagrams for ORR on K-N-C, N-C (N site), and N-C (C site) at equilibrium potential (U = 1.23 V), c) The differential charge density for *OH adsorption on K-N-C catalyst. Cyan and yellow iso-surfaces correspond to charge density contours of -0.02 and +0.02 e Å-3, respectively, d, e) Projected COHP for the K 4s - O (in *OH) and K 3p - O (in *OH) interactions on the K-N-C catalyst. Bonding and antibonding states are shown on the top and bottom, respectively. The horizontal gray lines indicate the Fermi level.