
Abstract
The importance of customer-oriented marketing has increased for companies in recent decades. With the advent of one-customer strategies, especially in e-commerce, traditional mass marketing in this area is becoming increasingly obsolete as customer-specific targeting becomes realizable. Such a strategy makes it essential to develop an underlying understanding of the interests and motivations of the individual customer. One method frequently used for this purpose is segmentation, which has evolved steadily in recent years. The aim of this paper is to provide a structured overview of the different segmentation methods and their current state of the art. For this purpose, we conducted an extensive literature search in which 105 publications between the years 2000 and 2022 were identified that deal with the analysis of customer behavior using segmentation methods. Based on this paper corpus, we provide a comprehensive review of the used methods. In addition, we examine the applied methods for temporal trends and for their applicability to different data set dimensionalities. Based on this paper corpus, we identified a four-phase process consisting of information (data) collection, customer representation, customer analysis via segmentation and customer targeting. With respect to customer representation and customer analysis by segmentation, we provide a comprehensive overview of the methods used in these process steps. We also take a look at temporal trends and the applicability to different dataset dimensionalities. In summary, customer representation is mainly solved by manual feature selection or RFM analysis. The most commonly used segmentation method is k-means, regardless of the use case and the amount of data. It is interesting to note that it has been widely used in recent years.
1 Introduction
“As the Internet emerges as a new marketing channel, analyzing and understanding the needs and expectations of their online users or customers are considered as prerequisites to activate the consumer-oriented electronic commerce. Thus, the mass marketing strategy cannot satisfy the needs and expectations of online customers. On the other hand, it is easier to extract knowledge out of the shopping process under the Internet environment. Market segmentation is one of the ways in which such knowledge can be represented and make it new business opportunities.” (Kim and Ahn 2004). Already in 2004, Kim and Ahn (2004) described an essential paradigm shift that online marketing was encountering in a time in which the world wide web was rising. The statement focused on the limitation of mass marketing in a period where data-driven technological possibilities arose to analyze web-users footprints and enable personalized-oriented marketing. About two decades later personalized-oriented marketing is still a key challenge that many researchers conduct in their work (Chen et al. 2018; Apichottanakul et al. 2021; de Marco et al. 2021; Nguyen 2021; Sokol and Holy 2021). Not only has it been shown that personalized customer targeting is more profitable for companies, but also that knowledge about customer behavior is a decisive factor for success and failure (Mulhern 1999; Zeithaml et al. 2001; Kumar et al. 2008). In this respect, it is essential to understand the customers and their needs, and to be aware of their behavioral changes over time (Liu et al. 2009; Ding et al. 2019; Griva et al. 2021; Apichottanakul et al. 2021). In addition to technological changes and increasing functional requirements, legal regulations are also subject to constant change. This results in further non-functional requirements, as these regulations firstly describe local conditions and secondly can counteract the functional objectives (Burri and Schär 2016; European-Parliament 2016). From a functional perspective, companies that want to analyze customer behavior need (1) the capacity to record customer data, (2) an algorithm to characterize similar user behavior, and (3) strategies or processes that use the extracted information to achieve the business goal.
Regarding the first requirement, it is necessary to collect data that enable algorithm-based characterization of user behavior. Thereby, we distinguish between customer behavior data that is collected explicitly and implicitly. As the names suggest, explicit data collection is intentional to collect customers’ information. In implicit data collection, the main purpose is not to collect information about customers, but to collect information about the process in which the customer appears as the interactant, such as purchase information for accounting purposes. Explicitly collected data such as demographic information, on the other hand, is difficult to collect and maintain for several reasons. Not all customers are willing to share demographic data or they browse anonymously on the web. In addition, information collected in this way is subject to change over time and, accordingly, is always subject to uncertainty that is difficult to quantify (Chan et al. 2011; Chen et al. 2018). Accordingly, implicitly gathered data is easier to collect. This data can be tracked with every user interaction. E.g. information about products that are purchased together or the amount of money spent for a purchase. Nonetheless, data collected in such an implicit manner requires deeper analytical skills to exploit.
For the second requirement, the gathered interaction data is used. A frequently used approach for managing different customers with diverse preferences is segmentation (Hong and Kim 2012; Hsieh 2004; Chen et al. 2018). Customer segmentation is an unsupervised-learning process and utilizes different clustering approaches which have the goal to separate aforementioned customer data based on similarity. Hereby, similarity is measured by an objective function such as euclidean distance. It should be noted that customer behavior is a continuous process, with customer needs, wants and satisfaction changing over time. Accordingly, the processes and underlying procedures implemented in companies must be flexible in order to accommodate this high level of dynamism (Liu et al. 2009; Ding et al. 2019; Griva et al. 2021).
The last requirement is to utilize the analyzed customer information. Domain experts like marketers can tailor appropriate marketing strategies for individual customer groups based on segmentation. As Birtolo et al. (2013) already stated and showed, instead of domain experts, more and more automated methods to extract and to learn underlying patterns in customer behavior allow to target customers in advance.
The aforementioned dynamics are not only reflected in the respective target market but also can be observed in the underlying segmentation methods. Therefore, the goal of our survey is to provide an overview of digital and autonomous customer targeting processes for customer relationship management (CRM) based on historical data. The main objective of the literature research lies in the customer segmentation process for different e-commerce related use cases like retailing or services in the banking sector. Our study is structured by three guiding questions, to which we provide answers in this work.
-
1.
Which clustering processes and methods are frequently used to understand customer behavior and targeting afterward?
-
2.
Are there methodological limits with regard to data dimensionality?
-
3.
Do methodological trends exist that can be observed over a period of two decades?
The main difference between our survey and former ones is that we focus on the process of customer targeting and behavior analysis in the e-commerce domain. The most recent literature review with a related topic is from 2016 (Sari et al. 2016). However, six years have passed since then, which makes an updated view necessary. Besides that in our study, we conduct a more extensive literature review that leads to a different classification of segmentation methods and more use case examples. In addition, we recognized a more extensive e-commerce process for customer targeting. Our contribution and main finding are:
-
We provide an overview with examples from the literature of how customer behavior analysis is used.
-
We determine a customer targeting process with four phases.
-
We could not identify a consensus in metrics to evaluate and compare the quality of the segmentation algorithm and therefore it cannot be said which of the methods is “best”.
-
Based on the frequency in publications and ability to handle large amounts of data, we recommend a process that uses RFM-analysis as a feature representation and k-means for segmentation.
-
We identify open questions and possible research gaps regarding embeddings for customer representation and deep learning-based segmentation for customer analysis and customer targeting strategies
Our study is structured as follows: In Sect. 2, we present and explain our research methodology. In Sect. 3, we present a literature overview of the identified works. Hence, in this section, we address the first guiding question accordingly and provide an answer. Moreover, we present the survey literature more in-depth. Based on the identified process, we notice that feature selection (be it manual or computerized) is an essential preprocessing step of customer behavior segmentation. Therefore, we explain the different segmentation and feature selection methods that are used. Additionally, the methods in the surveyed literature are described regarding the applied use cases for customer targeting and data volume. Section 3 ends with an overview of the publications’ evaluation metrics for customer segmentation. We analyze and discuss our findings in Sect. 4 which is further divided into two subsections. The first subsection is about the feature selection. In terms of feature selection methods, we present an answer to guiding question two and three. Similarly, in the second subsection we analyzes, discusses, and answers guiding questions two and three regarding the reviewed segmentation methods. In each subsection, we state open research questions that are not covered by our survey but have future potential. Finally, we conclude the survey in Sect. 5 with a brief summary of the findings and new open research questions and potential.
2 Literature research methodology
As already encouraged in the introduction we want to scientifically investigate which processes exist for personalized customer marketing approaches. Especially, to get an overview of commonly used customer segmentation methods in the context of CRM in e-commerce, we have conducted an extensive literature review. Thereby, Vom Brocke et al. (2015) published a recommendation on how to conduct such a search in an effective and highly qualified way. Hence, we followed their recommendation for the most part. Figure 1 illustrates our review process. We started our literature research by reading survey papers to derive an integrated and consolidated understanding of the conceptualization of the subject. Thereafter, we started the literature search. Therefore, we defined our search scope. Vom Brocke et al. (2015) refer to Cooper (1988) which states four steps on how to define a search scope: (1) process, (2) sources, (3) coverage, and (4) technique. Leaning on these four steps we choose a sequential search process. As a publication source, we used the Web of ScienceFootnote 1 (WoS) online research tool as it is one of the leading scientific citation and analytical platforms and provides scientific publications across a wide amount of knowledge domains (Li et al. 2018). To keep the focus on the customer segmentation methods we used the following search term:
-
“Customer segmentation” or “customer clustering” or “user segmentation” or “user clustering”
Herein, we chose to use the word “user” as a synonym for “customer” and “clustering” for “segmentation”. We wanted the search to be as less restrictive as possible to not miss relevant publications. Therefore, we expected works that are not relevant to our research. After having a corpus of hundreds of publications, we started reading the title, abstract, and keywords of the publications. We filtered out all publications that did not deal with customer behavior in commerce, especially in the context of e-commerce. The next step was to read all remaining papers and excluded all publications that did not deal with customer segmentation in an e-commerce use case and it became apparent that customers were segmented based on their information and actions. We extracted all wanted information from publications we classified as relevant. Specifically, we retrieved bibliometric information, information about the use case, the used methods, information about the used data, and the results.
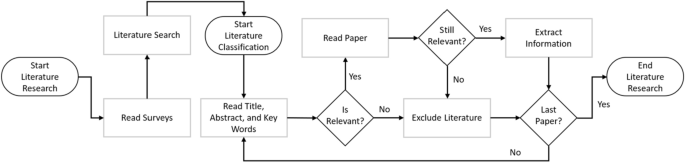
Flow chart of the literature research process
3 Literature overview
As aforementioned in Sect. 2, we started our literature review with reading related surveys. Plenty of research surveys in the field of segmentation prioritize the underlying methodology or class of methods but not their usage in specific domain (Gennari 1989; Rokach 2010; Hiziroglu 2013; Ben Ayed et al. 2014; Firdaus and Uddin 2015; Reddy and Vinzamuri 2018; Shi and Pun-Cheng 2019). For example, Shi and Pun-Cheng (2019) review clustering methods for spatiotemporal data which are collected in diverse domains like social media, human mobility, or transportation analysis. Another survey example is brought by Hiziroglu (2013). The author reviews segmentation approaches for applications of soft computing techniques. Other surveys or studies focus on specific methods like k-means or RFM-analysis (Sarvari et al. 2016; Deng and Gao 2020). The most related literature review we found in our literature search is from Sari et al. (2016) which reviews customer and marketing segmentation methods and the necessary data. They identify different segmentation approaches and e-commerce process which coincides in some parts with our outcomes. However, as already mentioned before, six years have already passed and their paper corpus consist of less than 20 publications. From this, we deduce the need for an up-to-date and more detailed review in the area of customer segmentation in e-commerce.
The WoS search from 2023/01/01 led to 852 publications, of which not all were related to our research as assumed. As described we excluded all publication that did not deal with customer behavior in e-commerce. The major domain that was not related to our research objective dealt with user segmentation in non-orthogonal multiple access (NOMA) techniques. Over half (66%) of the publications were not related to our research topic and we had 289 publications left that were somehow e-commerce related. From the 289 publications, we classified 149 publications as “not relevant” and 140 publications as “relevant” based on the title, abstract and keywords with the aforementioned criteria.

Process of customer targeting based on behavioral information gathered from data
Reading the remaining literature (140 publications), we paid particular attention to recurring processes. We identified a process that is constantly used to determine customer behavior with segmentation approaches. Figure 2 illustrates the identified process that depicts the answer to our first question. It illustrates the customer targeting process and it can be divided into four steps: (1) customer information, (2) customer representation, (3) customer analysis, and (4) customer targeting.
In the first step, the customer information is stored in form of data and is made available for further processing. In the literature, this step is usually given by provided datasets. Nevertheless, in some publications, the information is collected by the researcher. Especially, when data is collected explicitly which is for example done by Hong and Kim (2012), Nakano and Kondo (2018), and Wu (2011).
Based on the collected information a customer representation is built as the second step. The customers are represented by their features which are selected manually or with a feature selection method. In nearly half of the cases (47.6%), features are selected manually and in the other half (52.4%) feature selection methods are used. Both feature selection approaches have their advantages and disadvantages. For example, feature selection methods are utilized to eliminate features with less information content or to aggregate and extract additional knowledge out of the customer data. The most used method in our literature review is the Recency, Frequency, Monetary (RFM) analysis that aggregates additional information about the customers’ behavior and value to a company (Hughes 1994) which we show in Sect. 4. Manual feature selection usually is performed by extracting information like item view or click events, purchased items, and item information such as the associated category. In some other cases, mostly for recommendation, the authors additionally use ratings and reviews for the behavior analysis. Otherwise, demographic data is collected through membership or similar programs. Another approach to get demographic or psychographic information is by user surveys.
The third step of the found process is customer analysis which is the key component of the process and is done by applying segmentation methods. Customers are split into more homogeneous groups of similar behavior. This is done by different segmentation approaches, like methods that compare the similarity between the customer representation or other methods that partition the customers by given thresholds. In Sect. 3.4, we further explain the interaction of customer representation with feature selection methods and the customer analysis on found case studies.
The fourth and last step, customer targeting, uses the behavioral information from the customer analysis to target the right user with the right CRM decision. In the literature, we identified different targeting approaches which includes recommendation, marketing campaigns, and pricing strategies. The main difference in the literature is that recommenders are evaluated against others with evaluation metrics like hit-rate, accuracy, etc, and marketing campaigns or pricing strategies focus on the plausibility of the customer segmentation and try to explain the outcomes over the performance.
We decided to consider only literature that mostly adheres to this characteristic process because it fulfills all necessary conditions for personalized customer marketing which is our defined investigation scope. The work of Coussement et al. (2014) is an example of a scientific publication which we did not consider in our work because it is not in our scope. In their research, they investigated the impact of data quality on different segmentation methods and showed which methods are more robust to inaccuracies.

Distribution of surveyed publications from 2000 until 2022
Based on this aforementioned method, we further filtered our corpus to obtain a final corpus of 105 scientific papers. The literature is distributed between the years 2000 and 2022 over different use cases and journals. The reviewed publications are not equally distributed over the years. Figure 3 illustrates the distribution of the paper’s publication year. We see that there are more publications over time in the field of e-commerce considering customer analysis with segmentation methods. Before 2010, we usually find one publication per year. In the period from 2001 to 2003, however, there is no publication in the paper corpus at all. In total, there are 16 publications in the period from 2000 to 2010. After 2010, there are at least three publications per year with an increasing tendency. 43 out of 105 publications (about 41%) are published in 2020, 2021 and 2022.
Table 4 gives an overview of the 105 publications containing title, author, and year.Footnote 2
3.1 In-depth feature selection methods for customer representation

Distribution of the surveyed feature selection methods over the years
We identify customer representation as a fundamental step in the customer targeting process. Therefore, before applying segmentation methods for customer analysis an appropriated customer representation is needed. As mentioned earlier, this is achieved by applying feature selection methods. In the following, we will refer to manual feature selection as “none” feature selection method. Figure 4 displays the distribution of the used feature selection methods over the years as well as the total amount in percentage. In 50 publications, the authors decide to use handcrafted features to represent the customers.
The RFM-analysis is by far the most popular feature selection method with 44 (80%) of 55 publications that use feature selection methods and 41.9% in total. In the RFM-analysis three features are extracted from customer data. The features are recency, frequency, and monetary. Recency relates to the time of the last user activity, like a purchase. Frequency describes how often a customer interacts in a given period and monetary measures how much money a customer spends in that period (Hughes 1994). In some works, e.g., Stormi et al. (2020), Chang and Tsai (2011) the RFM-analysis is extended by additional features.
Principal component analysis (PCA) is applied in four publications. In 2015 and 2022 once and in 2020 twice. PCA is a dimensionality-reduction method in which the information content of the features is determined and features with low information content can be removed (Pearson 1901; Hotelling 1933).
Purchase Tree are used in two publications and were proposed by Chen et al. (2018). The fundamental idea is to represent purchased products by a tree in which products are the leafs and the product category the nodes of the tree.
The remaining five feature selection methods are each only used once. Chi-square Automatic Interaction Detectors (CHAID) is based on decision trees to handle categorical variables (Kass 1980). Customer Lifetime Value is a popular economic key performance indicators which describes the profit of the customer for the entire lifetime. Discrete wavelet transform captures location and frequency information. In Graph representation, the customer interaction is encoded in such. Multiple correspondence analysis (MCA) allows the representation of categorical features in lower-dimension.
3.2 In-depth customer segmentation methods

Distribution of the surveyed clustering methods over the years of publication
The authors of the reviewed publications utilize different customer segmentation methods for the customer targeting process. Figure 5 shows the distribution of segmentation methods among all publications and over the years.
K-means is the most frequently used customer segmentation method in our surveyed literature (41 of 105). The goal of the k-means algorithm is to partition a set of data points into k segments which minimize the distance between the data. Usually, the euclidean distance is used. Solving the underlying optimization problem is NP-hard and therefore, various approximation algorithms are used (MacQueen 1967; Lloyd 1982). The usage of k-medoids and other k-means variations is included in our k-means classification.
The second most used segmentation algorithms are Hybrid approaches that are used twelve times (11.4%), followed by Other approaches that are used ten times (9.5%). Hybrid clustering refers to the application of two or more clustering approaches to segment the customers. As “other” clustering, we define the clustering methods which don’t fit the previous cluster definitions. For example, Abbasimehr and Shabani (2021) propose a time series segmentation approach to get knowledge from customer behavior or Chen et al. (2018) proposed an segmentation an algorithm which they call PurTreeClust. Hsu and Chen, Y.-g.C. (2007) propose an algorithm to cluster mixed data which is named CAVE and An et al. (2018) proposes a segmentation algorithm based on non-negative matrix factorization.
Nine publications use Rule-based clustering to segment their customers into different behavioral groups. In rule-based approaches, data points are assigned to predefined segments by value thresholds.
In our surveyed literature, five publications utilize a Fuzzy C-Means (FCM) approach. In a fuzzy clustering algorithm, data points can be assigned to different clusters at the same time. The fuzzy c-means (FCM) clustering algorithm is a fuzzy version of the k-means algorithm (Dunn 1973; Bezdek et al. 1984).
Latent class models are used for the latent class analysis to classify discrete variables (Lazarsfeld 1950). This segmentation approach is used six times in the surveyed literature.
Evolutionary Algorithm (EA) are inspired by the biological evolution of living things. EAs are a class of optimization methods to find an approximate solution to a problem which also includes clustering. Simplified, the algorithm can be described as follows. In the first step, a random solution is initialized. The second step is to determine the quality of the solution using a fitness function. In the third step, the best solutions are selected and these are randomly changed, which is also referred to as mutation in this context. This process is repeated until a stopping criterion is met (Eiben and Smith 2003; De Jong 2016). Genetic algorithms (GA) like particle swarm optimization (PSO) (Kennedy and Eberhart 1995) or chaotic ant swarms (CAS) (Zhu et al. 2007) also belong to the family of EAs. Our survey contains five publications that utilize EAs.
Hierarchical clustering is utilized five times by the authors of the surveyed litterateur. The basic idea of hierarchical clustering is to bring similar data points close to each other regardless of the distribution. There are two approaches, known as the agglomerative and divisive approaches. In the agglomerative approach, the algorithm starts with each data point being in its own cluster. At each iteration step, the most similar clusters are merged until a distance criterion is met. The divisive approach works similarly, except that it starts with one cluster and splits in each iteration (Maimon and Rokach 2005).
Self-organizing map (SOM) is also used five times in our paper corpus and are based on neural networks. Neural networks are mainly used for supervised learning tasks. However, it is also possible to use neural networks in an unsupervised manner for clustering by pushing fully connected neurons towards the data points that are closest to them (Kohonen 1982).
The Rough Set Theory was introduced by Pawlak (1982) and is a data mining method to extract knowledge of databases. Besides the use for segmentation, the rough set theory can also be used for feature selection, data reduction, and other applications. In our research, we found three publication utilizing rougth sets to segment the customers.
Deep learning (DL)-based clustering, spectral clustering, and clustering via expectation-maximization are only used once. Similar to SOMs, deep learning-based clustering methods are based on neural networks. Nguyen (2021) presents a deep learning-based clustering approach named Deep Embedding Clustering that combines a deep neural network and a self-supervised probabilistic clustering technique. They state that their approach produces explainable customer segments. In the first step, they determine the optimal number of clusters with a spectral clustering approach and the elbow method. Then they encode their manually selected variables and apply the deep embedding clustering which is a deep autoencoder that is trained with the mean squared error (MSE) loss. The expectation-maximization (EM) algorithm performs a maximum likelihood estimation on given data points which consists of latent variables. It is an iterative approach that optimizes the mean and variance of the cluster distribution until it converges (Dempster et al. 1977). Spectral Clustering is a graph-based clustering approach in which distances between data points are represented by the edges. With the resulting graph’s Laplacian-matrix segments can be computed (Fiedler 1973; Donath and Hoffman 1973).
In the first decade (2000–2010) rule-based, Evolutionary Algorithms (EA), latent class, hybrid, and “other” clustering approaches were used twice. Both hybrid approaches were published in 2004. One hybrid approach combines k-means with a EA and the other combines a hierarchical approach with k-medoids. Hierarchical, fuzzy C-means, and rough set theory segmentation approaches are used once in the years between 2000 and 2010. Self-organizing map (SOM)-based segmentation was used three times which makes it the most applied method in this decade in our survey.
In the second decade (2011–2022), 89 of 105 (84.76%) relevant papers were published. K-means is used for the first time in 2011 (disregarding hybrid approaches). Since then, k-means has been used at least once a year. In 2014 k-means is used in two, 2015 in four, 2018 in five, 2020 in eight, and 2022 in eleven publications. Statistically, this indicates an upward trend. Also rule-based approaches are used repeatedly in the last years.
3.3 Overview customer targeting use cases
The underlying customer targeting process applies to a large amount of business and e-business use cases. In this section, we present an overview of which segmentation methods are used on which use case. Therefore, we briefly introduce the found e-commerce use cases.
The first category of use cases we want to introduce is Retailing. It is the sale of different goods that are not further specified and don’t belong to any other use case category. We also assign use cases to this category if it is not further specified. This means that a pure sports retailer is classified under the Sports use case, or a retailer that sells only clothing is classified under Fashion. Different to retailing, fashion is a dynamic industry (Brito et al. 2015). Like the fashion branch, Electronic is considered as a branch of e-commerce retailing. In the literature, some customer behavior segmentation use cases are related to Banking. Use cases in this category naturally have more information about the customer. In addition, the products and services don’t change as quickly as in retailing. In Mobile operators’ use cases the authors deal with data from mobile network providers. With Youtube, Netflix, and other companies, Video & music streaming platforms and services become very popular, and forecasts show that sales will also grow strongly in the coming years (statista.com 2022). In our literatur search we found some Book use cases that deal with book retailing or renting services. Nowadays, there a plenty of online services to plan a trip. In travel use cases we consider case studies that deal with trip-related action like hotel booking, reviewing, or trip and location recommendation. In our survey food use cases get their own category because in some cases it is difficult to distinguish between food retailing, restaurant reviews, or food production or manufacturing. Manufacturing in e-commerce comes with some benefits and new opportunities. One is product customization (Fan and Huang 2007). Another one is manufacturing-related services. In others use cases, we classify use cases that we could not determine explicitly or don’t fit in one of the other groups, e.g. online news or email campaigns of charitable organizations.
Table 1 shows in the rows all clustering method used in the literature. Each column represents one use case. A check mark indicates that we were able to identify an example for at least one use case. The number of checkmarks indicates the number of use cases we identify for the segmentation methods. Note, that in some publications, the utilized method is showcased on multiple use cases which leads to a mismatch between the number of publications and the number of use cases.
Retail is the most occurring use case in the surveyed litterateur with 43 case studies. The authors show with their publications that every segmentation method is usable to approach retail use cases. The retail use case is the only one that have examples for each segmentation method. Besides retail use cases, only travel and “other” use cases are approach by most of the segmentation methods for the customer analysis. The remaining use case categories have at least five different segmentation methods as an application example.
Regarding use case coverage, we found that k-means clustering are used to approach all use cases expect manufacturing. Thereby, k-means is utilized 16 times to approach retail and three times in bank, video and music, and “other” use cases each. Our literature review show that FCM is applied to seven different use cases. Rule-based, hierarchical, hybrid, and “other” segmentation approaches are applied on five different use cases.
3.4 Overview and examples of the interplay between customer representation and analysis for customer targeting use cases
The authors of the identified publications utilize different customer segmentation methods with different feature selection methods for the customer targeting process. In this section, we further investigate and describe these approaches to give a better insight into the interaction of the feature selection and segmentation methods. Table 2 provides an overview of the different segmentation methods with the corresponding feature selection approaches used. It also lists the number of times such a pair of segmentation method and feature selection was used in the paper corpus. The last column of the table shows the publication’s reference. In the following, we present some examples on how the different segmentation and feature selection methods are used in the found literature to approach customer targeting in e-commerce.
In nine publications rule-based clustering is used to segment the customers into different behavioral groups. Therefrom, seven use the RFM-analysis to represent their customers. An example retail use case that combines RFM-analysis and k-means is provided by Hsu and Huang (2020). In their research they want to identify VIP customers. VIP customers are buyers of critical products which are not purchased by the average customer. In their approach, they apply the RFM-analysis on over 600,000 transactions from around 3800 customers. The segmentation is based on the 20%-quantile of th RFM-values. Another example which utilzes rule-based segmentation with RFM-analysis is from Jonker et al. (2004). In their publication, the authors want to find the best marketing policy out of a set of policies for a customer. The data are from a mailing scenario of a charitable organization. They first utilise an on the email data adapted RFM-analysis and segment the customers based on defined thresholds. To identify the the best policy for a segment the authors used a markov decision process.
Two authors applied rule-based segmentation without applying a feature selection method. Hjort et al. (2013) want to investigate the impact of product returns in a fashion use case provided by Nelly.com which is a Scandinavian online fashion retailer. For the research, the scientists selected six features for each customer which are total sales, average sales per order, total contribution margin, average contribution margin, the total number of orders, and the total number of returns. Based on the feature information, they assign each customer to one of four groups. The groups are based on the buying and returning habits of the customers. The authors conclude from the customer analysis, that customers who tend to return goods are also the more valuable for the company.
In 16 publications the authors decide to not use a feature selection method but select features by hand before applying k-means clustering to the customer data. Authors of 21 publications use the value of RFM-analysis for the segmentation with k-means. Three research groups use a principal component analysis (PCA) for feature selection before clustering with k-means. Only Ding et al. (2019) use a graph representation before segmentation. The graph is built based on user-item interactions.
Griva (2022) analysis the customer of 140 e-commerce stores in European countries with k-means and hand crafted features. The features are extracted from 270,000 responses from a customer satisfaction survey and 1 million orders from 800,000 customers. They propose a framework which is capable to build automated marketing actions based on the created customer satisfaction segments. Example for such marketing actions are social media sharing strategies for the satisfied segments or discounts for the less satisfied customer segments.
Guney et al. (2020) are looking for the best campaign in movie rental use case (video on demand). In a first step they apply an modified RFM-approach which extract two additional features from the data. The two features are the number of days between the first and last rental and the standard deviation of the days between two rented movies. These five features are clustered via a k-means algorithm. The clustering results in four customer groups. An apriori algorithm namely an association rule mining approach is than used to assign the best marketing campaign to the customer segment.
In our selected literature six publications utilize an FCM approach. Ozer (2001) collects the data from customers of an online music service via a customer survey and doesn’t use a feature selection method before applying FCM on the features.
Nemati et al. (2018) search for the most appropriated marketing strategy for the customers of a telecommunication industry use case. First, they compute the customer lifetime value (CLV) for each customer and group them with FCM. To assign the right marketing strategy to the right segment they utilize a fuzzy TOPSIS technique.
For hotel businesses, customers’ satisfaction is crucial. Alghamdi (2022a) investigate customers’ satisfaction of hotel visitors in Mecca and Medina (Saudi Arabia). Therefore, they apply PCA on data collected from TripAdvisor and segment the resulting features via FCM.
Hierarchical clustering is used in five publications. Three authors handcraft their features. Aghabozorgi et al. (2012) calculate the necessary features by applying a discrete wavelet transformation (DWT) on customer data of a bank use case. In their research, DWT is an appropriate approach because they consider customer activities as a time series which is not the norm. After using DWT on the data, the data is initially segmented with a hierarchical clustering method. The cluster is updated incrementally in a given period with new data. Zhou et al. (2021) combines hierarchical clustering with an extended the RFM-analysis for a retail use case. The RFM-analysis is extended by the interpurchase time which results in four different features. The interpurchase time is defined as the time gap between two consecutive purchases in the same location (same website). Afterwards, the customers are clustered by the calculated features.
In our research, we have one publication from Dhandayudam and Krishnamurthi (2014) that combines RFM-analysis for feature selection with rough sets for clustering. In addition, they add another feature to the RFM-values that describes the average time between purchase and payment. They categorize all four features in their 20%-quantiles and then utilize a slightly modified rough set theory approach for the clustering. Song and Shepperd (2006), Wu (2011) don’t use feature selection methods before segmenting the customers with a rough set approach.
Clustering based on latent class models is used six times in the surveyed literature. Four of them manually select the features and therefore, don’t use feature selection methods. Nakano and Kondo (2018) use psychographic, demographic, online store, social media, and device touchpoint data. The information is clustered with a latent class analysis approach which results in seven segments. Goto et al. (2015) propose a method based on latent class analysis that clusters items and customers. They assume valuable users purchase more often only browsing and valuable products are bought more often. They use the latent class model to cluster the customers into “good users” and “other users”. To analyse the resulting segments they use the Classification and Regression Tree (CART) Algorithmus.
Wu and Chou (2011), Apichottanakul et al. (2021) use RFM-analysis for the feature selection and apply a latent class approach for the clustering. Apichottanakul et al. (2021) use the proposed GRFM approach from Chang and Tsai (2011) to analyse the customers of a pork processing use case. First, the RFM scores are calculated for nine product categories and each feature is categorized in one of five categories based on the 20%-quantile. The features are clustered with a probabilistic latent class model. Apriori the optimal number of k is unknown therefore, a suitable number of clusters is determined with the Akaike Information Criterion (Akaike 1974). In the last step, the clusters are analyzed with the help of the RFM-values.
The only publication that uses the EM algorithm for clustering is from Rezaeinia and Rahmani (2016). The goal of their work is to recommend products in a retail use case. Therefore, they first compute the features via RFM-analysis and cluster them with an EM approach for customer targeting.
Spectral clustering is used by Chen et al. (2019) to segment customers buying behavior. Therefore, they use a Purchase Tree representation for customers transactions which was proposed earlier by Chen et al. (2018). For the customer segmentation, they propose a two-level subspace weighting spectral clustering algorithm. Spectral clustering approaches are used only once in our literature.
Our survey contains five publications that utilize EAs for customer clustering of which two use RFM-analysis and three don’t use a feature selection method on the available data. Both publications using RFM-analysis are published by or with Chu Chai Henry Chan. In his publication from 2007, the task is to determine an appropriated strategy for each customer of an Nissan automobile retailer. Therefore, Chan (2008) computes the features from the RFM-analysis and categorizes the values in one of five 20%-quantiles. Then the features are binary encoded with four bits. Based on the binary features a GA is used with the customer lifetime value (CLTV) as the fitness function. In 2016, Chan et al. (2016) apply the same feature preprocessing and PSO with CLTV as fitness function on a similar use case but with more data.
SOMs are used in five publications in total. Verdu et al. (2006); Nilashi et al. (2021) utilize handcrafted features to represent the customers. In the remaining three publications customers are represented by their RFM-values. For example, Hsieh (2004); Liu et al. (2009) combine an RFM-analysis feature extraction with a SOM clustering to segment the customers in their case study. A recent example of an SOM approach is proposed by Liao et al. (2022). They develop different marketing strategies for each segment for a retail use case. Therefore, they use an extended RFM-analysis approach to represent the customers. The extension is not only using RFM-analysis on customer purchase information but also on other behavioral information like clicks, add-to-cart, or add-to-favorite. For this, they utilize 2 million customer interaction records. The SOM approach is than applied on the different RFM-values of the customers to segment them in similar behavioral groups.
Nguyen (2021) presents a deep learning-based clustering approach named Deep Embedding Clustering that combines a deep neural network and a self-supervised probabilistic clustering technique. They state that their approach produces explainable customer segments. In the first step, they determine the optimal number of clusters with a spectral clustering approach and the elbow method. Then they encode their manually selected variables and apply the deep embedding clustering which is a deep autoencoder that is trained with the mean squared error (MSE) loss.
In our literature review, we found twelve research papers that use hybrid clustering methods. In ten publications no feature selecteion method is used. For example, Kang et al. (2012) don’t utilize a feature selection. They split the dataset into two sets of answering customers and not answering customers. The data points are clustered with a k-means and CSI Algorithm with different criteria. Kim and Ahn (2004) use (CHAID) as a feature preprocessing. The clustering is performed by a GA based on k-means clustering. Jadwal et al. (2022) use MCA as feature preprocessing and segment the customers of a bank use case with an segmentation approach based on k-means and hierarchical clustering.
In our survey, we classified ten publications as “other clustering”. Six authors have manually selected features. In three publications the RFM-analysis is used as feature selection method. For example, Abbasimehr and Shabani (2021) propose a time series clustering approach to get knowledge from customer behavior. First, they split the dataset into predefined time intervals. As a second step, they apply RFM-analysis on each interval and use the monetary value of the customer for the time series. On the resulting time series, a time series clustering approach is applied. Also, Hu and Yeh (2014) utilize RFM-analysis based features for the clustering. Therefore, they propose an RFM-pattern-tree to represent customers which also is used to approximate customers with less information. They can use this to detect similar customers with similar behavior. Simoes and Nogueira (2021) uses RFM-features and segment the customers with an ABC curve segmentation. Chen et al. (2018). represent the data as a Purchase Tree and propose for the segmentation an algorithm which they call PurTreeClust and is based on a partitional clustering algorithm.
3.5 An overview of the data dimensionality in the publications’ experiments
An essential component for the behavior analysis and customer targeting process is the information that is collected by the companies. In this section, we describe which methods are used for which data in respect to the order of magnitude. We distinguish between two different types of data amount. The first is the number of data points e.g. transactions and it describes the amount of data an algorithm can handle at least. The second type is the number of customers in a dataset.
The number of customers may indicate how much data an algorithm can process because customers and not data points are segmented. Therefore, it is important to consider the number of customers when analyzing the data dimensionality. Depending on the number of customers the number of data points can be reduced after a feature selection method. For example, in RFM-analysis the information of a user is aggregated for one period which leads to fewer data points the clustering algorithm needs to process. Other feature selection approaches like PCA doesn’t affect the number of data points or user but the number of features.
Table 3 shows which feature selection methods and clustering algorithms are used with which data dimensionality regarding the number of data points and the number of customers in the use case. The number of data points is described by six columns of which each has a different order of magnitude. We choose a similar representation for the number of customers in a dataset but only have five columns. We annotate the methods that deal with this amount of data with checkmarks. Note, that not all publications describe the data in a way it is possible to extract the information of the data dimensionality. In some cases, only the number of data points are given, in others, we only know about the number of customers, and sometimes we don’t have information at all. How often a method is used, is indicated by the number of checkmarks. In some publications, different datasets with different sizes are utilized. If two datasets have different orders of magnitude, we indicated it by using checkmarks in the appropriated cells. However, if the datasets in the same publication have the same order of magnitude, we indicated it only once per publication.
In terms of feature selection, we see that RFM-analysis is applied up to \(10^8\) data points, but above this number of data points it is not used anymore. For example, Akhondzadeh-Noughabi and Albadvi (2015) apply RFM-analysis on 35,537,276 customer activities from 14,772 customers.
Based on the survey literature, PCA and DWT can be applied to data with up to 1 million data points. The graph approach utilized by Ding et al. (2019) is used on around 50,000 user activities. Chen et al. (2018, 2019) propose a purchase Tree approach which is tested on several datasets with different sizes in a range of a few thousand and 350 million transactions with customer numbers between 800 and 300,000.
The clustering method rows only refer to the clustering algorithms where no feature selection methods are applied. Regarding the number of users in datasets, we see that usually, their number doesn’t exceed 10,000. An expectation is provided by Kang et al. (2012). They test their hybrid approach on two datasets in which one dataset contains information about 101,532 customers. Another one comes from Goto et al. (2015) where they apply a latent class model on 37,278,907 browsing actions from 99,924 users. Abdolvand et al. (2015) apply k-means on 25,000 bank customers. Investigating which clustering methods are used for data with at least one million entries, we identify that it is k-means clustering, latent class models, and hybrid clustering approaches. K-means is used twice on over a million data points by Liu et al. (2015); Zhang et al. (2014). Liu et al. (2015) have access to 3 million transaction data from taoboa.com. Zhang et al. (2014) use the MovieLens datasets in which one has 100,000 movie ratings of 1682 different movies rated by 943 different users and the other has 1 million ratings for 3952 movies made by 6040 users.
3.6 Evaluation metrics
Usually, a clustering model learns in an unsupervised manner and the ground truth is unknown. Therefore different criteria need to be used to evaluate their performance. In the following the frequently used evaluation measures are described and briefly analyzed.
Clustering evaluation or cluster validation is an essential step in verifying the discovered groups in a data set. The fundamental challenge of evaluation lies in the missing ground truth, which can be a reason that we have not found a consensus between the evaluation methods in our literature research. Figure 6 presents the distribution of used evaluation methods for segmentation methods in the literature that also shows the missing consensus. We classified the evaluation criteria into seven different groups which are indicated by a color. In the following, we briefly introduce the evaluation criteria and give some examples. It should be noted, that in some publications the authors don’t apply evaluation metrics. Instead, they analyze the segments based on their plausibility. Chan et al. (2011) for example, measures the performance of the proposed method by comparing the company’s sails before and after the using the approach. Guney et al. (2020), Nie et al. (2021), Wu et al. (2020) evaluate the segments with the help of the RFM-values.

Distribution of the segmentation methods used evaluation methods
Statistical significance test The underlying concept of a Statistical significance test is to determine whether the data points are randomly distributed or not. Krishna and Ravi (2021) have used a statistical t-test to evaluate their genetic algorithm approach on five different datasets. Another approach is the Kendall coefficient (Kendall 1938) that is used by An et al. (2018).
Analysis of variance The basic idea behind the analysis of variance (ANOVA) is to analyze whether the expected values of variables differ in distinct groups. By testing, if the variance of a variable is larger or smaller between the groups than within the groups, a statement about the meaningfulness of the group can be determined. ANOVA tests are used by Li et al. (2009), Hong and Kim (2012), Hjort et al. (2013), Hiziroglu et al. (2018).
Silhouette analysis The silhouette analysis is a (visual) validation method that is independent of the number of clusters and determines the consistency within a cluster. In addition to validation, this method can also be used to find the optimal number of clusters (Rousseeuw 1987). For example, the silhouette analysis is used by Akhondzadeh-Noughabi and Albadvi (2015), Peker et al. (2017), Christy et al. (2018).
Indices As shown in Fig. 6 many different index metrics were used to validate the clustering performance. The most used indices in our literature review are Davies-Bouldin (DB) index, Calinski-Harabasz (CH) index, and Xie-Beni (XB) index. The DB index describes the average similarity of each cluster with its most similar cluster. The DB index is to be interpreted in such a way that the lower the value is, the better the clustering (Davies and Bouldin 1979). The CH index, is the ratio of intra-cluster dispersion and inter-cluster dispersion (Caliński and Harabasz 1974). The XB index is used for fuzzy segmentation approaches and describes the separation and compactness of the clusters. The optimal number of clusters has the lowest XB value (Xie and Beni 1991). Chan et al. (2016) evaluate their proposed EA clustering with the DB index. Munusamy and Murugesan (2020) evaluate their fuzzy c-means clustering approach with XB index but also with the Kwon index, and the Tang index. They also use error measures for the cluster evaluation.
Information criteria These measures are used to select the models that fit the given data best but also take the number of parameters into account to prevent overfitting. One popular information criterion is the Akaike information criterion (AIC) which describes the model’s information based on the number of parameters and the model’s log-likelihood (Akaike 1974). Apichottanakul et al. (2021) utilize the AIC for evaluation to determine the optimal number of clusters in their latent class model.
Error measures Another evaluation method that is used in the surveyed literature is based on error measures like the mean absolute error (MAE), sum of squared error (SSE), root mean squared error (RMSE), or symmetric mean absolute percentage error (SMAPE). Abbasimehr and Shabani (2021) measure the cluster performance with SMAPE. Aghabozorgi et al. (2012) evaluate their proposed hierarchical clustering with SSE. Also, Lam et al. (2021) evaluate their clustering approach with SSE.
Others Some authors combine several evaluation metrics to express the usefulness and quality of their clustering models or use methods which donot fit in the six categories above. The mostly used “other” metric is cluster distance. We classify all inter and intra-cluster distance metrics as cluster distance if they are not further explained by the authors. For example, Wan et al. (2010) utilize an inter and intra-cluster distance to show that their CAS clustering approach has better distances and is more stable than k-means. Sivaguru and Punniyamoorthy (2021) apply a within/total clustering error index (which we consider as a cluster distance metric) to evaluate their k-means approach. In addition, they utilize DB index and t-test too. Umuhoza et al. (2020) utilize the elbow method, silhouette score, and CH index to determine the optimal number of segments. Another metric is the concordance (C) statistic (C-index) also known as receiver operating characteristic (ROC) and associated area under curve (AUC) score is for example used by Hsu et al. (2012) (also use SVM, isolation, and AVG index) or Barman and Chowdhury (2019). Dhandayudam and Krishnamurthi (2014) uses cohesion and coupling to evaluate the cluster quality for their rough set theory approach. Griva et al. (2021) use cohesion, inter and intracluster distance, similarity, and separation for cluster validation and gap statistic plus silhouette analysis to determine the optimal number for their latent class model clustering. Ramadas and Abraham (2018) validate the hybrid clustering which combines GA and fuzzy c-means with a partition coefficient (degree of intersection of clusters), classification entropy (the fuzziness of clusters), XB index, separation index, and partition index. Abdolvand et al. (2015) utilize the DB index to determine the optimal number of segments for their k-means approach and data envelopment analysis (DEA) for the evaluation.
4 Analysis and discussion
As previously shown in Fig. 3, the reviewed publications were not equally distributed over the years. An upward trend in the number of publications can be recognized which indicates the importance of customer behavior analysis and therefore, their segmentation even after twenty decades of research. Especially, in the years 2020, 2021, and 2022, we have found more publications than the years before. There may be several reasons for this. The first reason that comes to mind is the current covid pandemic. This has increased the growth in e-commerce services. This could have prompted less digitalized companies to digitalize more and offer their services online. In many publications the company remains unknown. However, in some other publications the companies are named. Two examples are taobao.com or nelly.com that are established online companies which is an indication against our statement. From the literature conducted experiments did not show the state of digitization of the companies. Therefore, whether this connection exists remains open, and is not further investigated by us. Another reason, and in our opinion a more decisive one, is the increasing availability of the internet regardless of location. This means that a user can access the available online services at any time and from any place. For example, watching a series during a train ride or buying a new product at the online retailer of choice. With new requirements and necessities, the topic is also becoming more relevant in science and thus more is being published.
4.1 Analysis of feature selection methods
Based on our research, feature selection to represent customers is a fundamental step in the customer targeting process. For feature selection, customer information is indispensable. It is a challenge to get customers’ demographic information, physiographic information, or information about their preferences. As already stated, there are two possible ways to collect such data. Explicit information collection is done by questionnaires or user surveys that require customers’ accommodation to participate. Another, more implicit way is to collect demographic information via registration. Information can be collected by setting them as mandatory. Nevertheless, collecting data via registration is often limited to the usual information like age, gender, or address. In some use cases, like fashion, additional information about height and weight can be collected. It needs to be considered, that some users don’t want to provide any information and wish to remain anonymous. They either give false information or leave the website (service). In both cases, it is not possible to gather useful information and in the worst case, the former leads to false conclusions regarding the customers. Furthermore, user groups that don’t participate in a survey or are signed up are not represented in the data which makes the acquisition of unknown and new customers harder.
It is possible to gather customers’ preferences with the aforementioned method. Nevertheless, this comes with a huge disadvantage. The information is outdated soon and needs to be constantly updated which increases the maintaining effort. Constantly asking the customer for an information update can also cause him to quit as a consequence. Therefore, customer preference should be estimated based on their recent behavior. Customer behavior information can be recorded implicitly. Usually, purchase information with product information, timestamp, etc., is stored for a company’s financial overview. In addition, online touchpoints with the customer can be logged by the system. These logs can include various touchpoints like product views, click events, reviews, (dis)like, and many more. The advantages are that the customers do not disclose any personal information. Also, they are likely not interrupted on their shopping journey by unwanted questions. Nevertheless, disadvantages exist too. Predicting customer information from their behavior is not always correct that is for example caused by customers’ heterogeneity. Additionally, a large amount of data is required to make such predictions. Another challenge of implicit data collection is that the information needs to be linked to the customer. However, there are plenty of tracking-techniques to link the data with customers by using cookies or the browser identifier to name two examples.
As shown in Fig. 4, for the customer process as a whole, it makes no difference whether a feature selection method is used or the features are selected or handcrafted by an expert. However, manual feature selection and feature selection methods have their pros and cons.
One advantage of manual feature selection is that no additional computation is required. However, it requires expertise and domain knowledge to select customer information that is meaningful and representative. Feature selection methods are designed to automate the selection of features. One advantage is that domain knowledge is no longer required. However, this doesn’t mean that domain knowledge should generally be dispensed with. Another argument in favor of feature selection methods is that information redundancy can be removed. Redundancies come in hand with the amount of data collected. Removing unnecessary and redundant information can speed up the customer analysis algorithms. This information is hard to determine and select manually even with domain knowledge. Regarding Table 3, we notice that feature selection methods have processed larger amounts of data in our literature. Considering our second question from the introduction, we can state that feature selection methods allow larger amounts of data for customer behavior analysis. Particularly, the RFM-analysis and Purchase Tree have no limitation concerning the data dimensionality based on our research.
Our literature research shows that the RFM-analysis is by far the most popular feature selection method. Therefore, we analyze the RFM-analysis method in more detail hereafter and discuss the advantages and disadvantages. During the literature research, several points caught our attention. The RFM-analysis could be applied to almost any type of purchase or activity data since only three features need to be calculated. Furthermore, the calculation is very simple and requires only the basic arithmetic operations. So there is valuable customer representation in only three values. These values can be represented either numerically or categorically. For the categorical representation, the values were typically divided into five categories, each with 20%-quantiles. Thus, the obtained features are used for any clustering method. In addition, we notice that the RFM-analysis is often extended with additional features. The feature extension is usually use case-specific. Besides adding new features, the RFM-features are extended on different activity levels. For example, the RFM-values are calculated for all product categories or different customer activities. This provides additional information about the customer’s product preference at the category or activity level. Another advantage of RFM-analysis is that it can handle all sizes of data sets without having a scalability problem. This has been sufficiently demonstrated in the publications and is illustrated by Table 3. We also like to note that in some publications, the RFM-analysis is used to explain the resulting clusters and helps with the customer behavior analysis which shows that decision makers can easily understand and interpret the RFM-values. Based on our findings to feature selection methods, we can answer the third question as follows. For feature selection methods no time-depended methodological trend could be determined. However, the most popular feature selection method is the RFM-analysis.
These versatile properties of the RFM-analysis are the reason for its popularity which is also stated by Chan et al. (2011), Alberto Carrasco et al. (2019). Despite it being the most used feature selection method, we also identified weaknesses in the RFM-analysis that all found customer representation has in common. The RFM-analysis, other feature selection methods like PCA, or manual feature selection don’t consider the whole information content of the accessible data. However, to represent more information, more features and therefore, more memory is required, which also increases the computation time for the segmentation methods. Another issue is that there is information in the data that cannot be extracted using feature selection methods or expertise. Recently, embeddings become a popular approach for representations. Embeddings are capable to represent words as shown by Mikolov et al. (2013), time series (Nalmpantis and Vrakas 2019), or products (Vasile et al. 2016) but are not limited to them. With embeddings, it could be possible to encode additional behavioral information that could improve the customer targeting process. This was already demonstrated for product recommendation (Vasile et al. 2016; Tercan et al. 2021; Alves Gomes et al. 2021; Srilakshmi et al. 2022) or customers’ purchase behavior prediction (Alves Gomes et al. 2022). Despite the popularity in several e-commerce tasks, no author used an customer embedding representation in the reviewed literature. From our perspective, the reason is that embeddings are less interpretable, and therefore, non-automated customer targeting is more difficult.
4.2 Analysis of segmentation methods
We found 13 different types of segmentation methods. K-means is by far the most used approach. Especially, in the last years from 2020 to 2022 k-means is used 24 times. In regard to the third guiding question, we can conclude that besides a k-means upwards trend no other trend can be spotted. The question that now arises is “why is k-means becoming so popular recently”? One answer is that k-means is simple to implement and an established approach. In contrast, other approaches like EAs, hierarchical clustering, or SOMs are more complex according to how the run time or space requirements grow as the input size grows (Bachmann-Landau notation) and it needs more effort to implement them (Firdaus and Uddin 2015). The ever-increasing amounts of data in e-commerce amplifies this trend because simple methods can be used more quickly, and thus, results can be obtained faster. However, if this is the reason, then the question that follows is why are rule-based approaches not popular as well? As shown by Fig. 5 the density of rule-base approaches increased in the years between 2018 and 2021 but some other influencing factors play a major role on the methods popularity. While we can only make assumptions at this point, rule-based segmentation approaches have significant drawbacks. For example, they require domain knowledge to set appropriate thresholds for separating customer segments. The increasing and heterogeneous amount of data complicates this setting of appropriate thresholds or requires a higher dynamic, which in turn results in more rules and complex relationships. Our assumption is supported by the aggregated information in Table 3 that shows that k-means is applicable on 100 million data points.
Considering the data dimensionality which is used in the publications we see that k-means approaches can handle a larger amount of data and is in pair with latent class approaches. As we mentioned, the hybrid approach that uses the largest amount of data is a combination of the latent class model. However, concerning the number of customers in the data which are the objective of the clustering, the numbers rarely exceed the 10,000. This indicates that clustering approaches need an appropriate feature selection method to deal with a larger amount of data. All this doesn’t mean that the methods cannot be applied to larger data sets. Our argumentation is based solely on the paper corpus we saw. Based on the findings concerning the data dimensionality, we can state for guiding question number three, that k-means and latent class models can process the largest amount of data among all segmentation methods. However, as already stated this applies only in case of manual feature selection. We recommend using a feature selection methods namely the RFM-analysis that allows to process any kind of data dimensionality. Note that we don’t address the time or memory complexity of the segmentation methods, which is also a performance indicator, but evaluate them based solely on the amount of data used in the literature.
In terms of use cases, we can state that each clustering method is usable in retailing use cases. We cannot make such a generalized statement for other domains. However, it is not unlikely that all segmentation methods can be used independently of the domain. Especially with k-means, we can see that it has the largest variant of different use cases. Nonetheless, the reason for being used in different domains can be because k-means is applied in most publications.
Apart from a quantitative analysis of the segmentation method, we would like to make a qualitative analysis. Unfortunately, there is no way to determine which segmentation method performs best. The major issue in our opinion is that there is no ground truth for the customer segments to determine a score. Therefore, there is no unified method for qualitative evaluation which is necessary to state which segmentation method is superior to the other. We noticed that there are a vast amount of different evaluation methods as presented in Sect. 3.6. Different evaluation approaches are required for different clustering approaches, i.e. fuzzy (soft) clustering has different properties than hard clustering. It would simplify qualitative segmentation analysis if the scientific community agree on a small set of evaluation methods. The urge is there which we can see in the number of different evaluation metrics and the considered publication where the authors try to show that their approach is superior to others. If everyone would use the same metrics, the authors’ efforts would have more significance and the performance of the method could be compared over different publications which are usually done in other scientific disciplines. Nevertheless, due to the absence of ground truth, correctness can never be shown, and therefore, the purpose of unified evaluation methods may be questioned. Another aspect we want to consider is evaluation metrics with semantic interpretability. Such metrics would have the advantage to show which segmentation algorithm partitions the customers in a desirable way. Furthermore, it would create comparability between multiple segmentation methods for identical use cases. However, the challenge is to define evaluation metrics that have the capacity to be semantic interpretable and, at the same time, can be applied to different segmentation methods and use cases. In numerous publications, evaluation methods are used to find the optimal number of segments. Therefore, even if there is no defined uniform way to compare clustering approaches, they still have their reason of existence and are necessary methods for determining an optimal number of segments.
Before the study, we would not have expected such a distribution, as we thought that a relatively old method like k-means (first proposed around 1960 and published in 1982) is not so often used especially not so often in the last years of the considered literature. In addition, we assumed that there would be newer and more innovative approaches like deep learning-based approaches. The reason for our assumption is that deep learning techniques archived great results in a broad range of applications such as computer vision and natural language processing and we expected to see these methods transferred to customer segmentation and analysis. However, deep learning-based segmentation only appeared once in the literature. Regarding our initial assumption, an open question still remains. Will deep learning methods be used for customer segmentation in the future? As with embeddings used as feature representations, one advantage might be that the feature representation phase can be omitted, and thus less information is lost. However, a disadvantage and probably the reason why we did not find more than one deep learning-based segmentation method is that the customer segmentation needs to be formalized as a learning problem. Furthermore, segmentation is by design an unsupervised process and no ground truth exists. Another point that speaks against deep learning segmentation is that deep learning models are black boxes and therefore, interpretation, explainability, and reasoning for decision making are no longer achievable.
Based on our findings and analysis, we recommend using k-means or rule-based segmentation approaches which are easy to use and implement, to partition different customers for e-commerce use cases. In addition, if massive transaction data is available, we recommend RFM-analysis for the customer representation that can be extended with additional features.
5 Conclusion and future research
In this survey, we provided an extensive literature review on customer targeting process for e-commerce use cases whose main focus lies in the segmentation methods for customer behavior analysis. Our goal was to provide an overview of segmentation methods used in the literature and to determine best-practice approaches and their limitations. We introduced the steps of the research and key criteria for the paper selection and analyzed as well as discussed our findings afterward. In our work, we considered 105 publications with different case studies that focused on customer analysis with segmentation methods.
Summarizing the approaches examined, the identified four-step process emerges as the current gold standard for personalized customer targeting in e-commerce. For the customer representation, either hand-crafted features or an RFM analysis adapted to the use case are generally used. Subsequently, for customer analysis, the generated customer representation is segmented using a k-means approach.
Based on our research and literature analysis we made several findings regarding our investigated topic.
-
We identified a common process for personalized customer targeting which includes feature selection methods, customer segmentation, and customer targeting. This process is illustrated by Fig. 2 and can be utilized to plan customer targeting campaigns. Each of the four steps has its own requirements and its a discipline of its own worth to be investigated. We focused on the customer analysis and customer representation part.
-
Over the years, the number of publication that deals with customer targeting in e-commerce are continuously increasing. This supports the preceding assumption that it is a time-relevant subject.
-
Feature selection methods enable the usage of larger datasets and among the utilized methods the RFM-analysis is by far the most popular one. There are many reasons for this: first, the method is easy to use, and second, it is based on features that can be extracted and understood. Another advantage of RFM analysis is the possibility of its easy adaptation to specific use cases by adding further or changing existing features.
-
In approximately half of the publications (47.6%), manual feature selection was used.
-
Among all the used clustering methods, k-means has emerged as the most popular approach (39% in total). Since 2011, it was repeatably used. Besides that, no other over-time trend was identified. The popularity of k-means can be explained by its simplicity and applicability to large scale datasets.
-
We were not able to define the best clustering approach based on its performance because many different evaluation methods exist and were used to evaluate the cluster quality.
-
Some evaluation methods can be used to determine the optimal number of segments which is unknown from the beginning and is often a tunable hyperparameter.
-
The literature review doesn’t show that a segmentation method exists that is applicable to every e-commerce use case that involves customer analysis. This could only be suggested, if at all, for the retail use case. In terms of method, k-means has been used in every use case identified, with the exception of the manufacturing use case.
New insights always come with new challenges and opportunities. Based on our research and findings we propose future research ideas which should be investigated. Especially with regard to recent developments in the field of Deep Learning, there are many approaches that can be adapted and, according to the our assessment, display a lot of potential.
-
Deep learning introduced innovations in many domains such as natural language processing and computer vision. Nevertheless, we only found one DL-based segmentation approach in our research. Therefore, we see potential and a research gap in DL techniques for segmentation.
-
The process steps in the identified four-phase process for customer targeting are essentially based on a high level of understanding of the customers, i.e. their needs and behavior. This is necessary for marketing and domain expert to tailor personalized marketing strategies for the customers. However, with the advent of deep learning-based approaches personalized customer targeting can be done fully automated e.g. end-to-end model and therefore, the customer analysis step which includes customer segmentation can be omitted. This development can be seen for example in deep learning-based recommendation systems which make personalized recommendation without the need of the customer analysis. This leads to the question; How customizable are the individual phases of this process and can individual steps be omitted to increase efficiency or are all steps so fundamental that a deviation from these procedures would have a negative impact on the goal, customer targeting?
-
Manual feature selection is still frequently used. The feature quality is thereby highly depended on the underlying expertise to select or define important features for clustering. Progressive digitization is leading to growing challenges, especially in dealing with data volumes and data diversity. To meet these challenges, manual feature selection is reaching its limits as it is not able to tap the insight potential within this data. Hence, the question arises if approaches exist that can help experts to create meaningful and representative features for customer representation?
In this regard a look outside the box to other e-commerce research, e.g. click-through rates prediction can yield new approaches. There researchers and professionals have started using feature embeddings on manual selected features with the underlying assumption that the learning models will learn meaningful representations from the data. This would simplify the manual feature selection process. However, these learning models are usually based on deep neural networks which are unfortunately black boxes and not interpretable. The question rises, if segmentation methods can be used as a post-processing to provide interpretability for the embedded features and therefore, an insight over the customers? (Which got lost by not using the customer analysis step).
-
In our research, we identified many different evaluation metrics to evaluate the performance of segmentation methods. Nevertheless, we could not find a consensus on evaluation metrics as in other domains. The reason is the missing ground-truth. This circumstance makes it difficult to determine the effectiveness and transferability of a segmentation approach from one use case to another. The open question that remains is, is it necessary, to develop evaluation metrics with semantic meaning and is it possible to transfer such metrics to different experiments to enable comparision of the segmentation methods?
In our literature review, we covered the usage of feature selection and segmentation method for personalized customer targeting. E-commerce is a dynamic environment with ever new challenges and therefore, new research opportunities.
Notes
References
Abbasimehr H, Shabani M (2021) A new framework for predicting customer behavior in terms of RFM by considering the temporal aspect based on time series techniques. J Ambient Intell Hum Comput 12(1):515–531. https://doi.org/10.1007/s12652-020-02015-w
Abdolvand N, Albadvi A, Aghdasi M (2015) Performance management using a value-based customer-centered model. Int J Prod Res 53(18):5472–5483. https://doi.org/10.1080/00207543.2015.1026613
Aghabozorgi S, Saybani MR, Teh YW (2012) Incremental clustering of time-series by fuzzy clustering. J Inf Sci Eng 28(4):671–688
Akaike H (1974) A new look at the statistical model identification. IEEE Trans Autom Control 19(6):716–723
Akhondzadeh-Noughabi E, Albadvi A (2015) Mining the dominant patterns of customer shifts between segments by using top-k and distinguishing sequential rules. Manag Decis 53(9):1976–2003. https://doi.org/10.1108/MD-09-2014-0551
Alberto Carrasco R, Francisca Blasco M, Garcia-Madariaga J, Herrera-Viedma E (2019) A fuzzy linguistic RMF model applied to campaign management. Int J Interact Multimed Artif Intell 5(4):21–27. https://doi.org/10.9781/ijimai.2018.03.003
Alghamdi A (2022) A hybrid method for big data analysis using fuzzy clustering, feature selection and adaptive neuro-fuzzy inferences system techniques: case of Mecca and Medina hotels in Saudi Arabia. Arab J Sci Eng. https://doi.org/10.1007/s13369-022-06978-0
Alghamdi A (2022) A hybrid method for customer segmentation in Saudi Arabia restaurants using clustering, neural networks and optimization learning techniques. Arab J Sci Eng. https://doi.org/10.1007/s13369-022-07091-y
Alves Gomes M, Tercan H, Bodnar T, Meisen T, Meisen P (2021) A filter is better than none: improving deep learning-based product recommendation models by using a user preference filter. In: 2021 IEEE 23rd int conf on high performance computing and communications; 7th int conf on data science and systems; 19th int conf on smart city; 7th int conf on dependability in sensor, cloud and big data systems and application (hpcc/dss/smartcity/dependsys) (pp 1278–1285). https://doi.org/10.1109/HPCC-DSS-SmartCity-DependSys53884.2021.00195
An J, Kwak H, Jung S-g, Salminen J, Jansen BJ (2018) Customer segmentation using online platforms: isolating behavioral and demographic segments for persona creation via aggregated user data. Soc Netw Anal Mining. https://doi.org/10.1007/s13278-018-0531-0
Apichottanakul A, Goto M, Piewthongngam K, Pathumnakul S (2021) Customer behaviour analysis based on buying-data sparsity for multicategory products in pork industry: a hybrid approach. Cogent Eng. https://doi.org/10.1080/23311916.2020.1865598
Araujo C, Soares C, Pereira I, Coelho D, Rebelo MA, Madureira A (2022) A novel approach for send time prediction on email marketing. Appl Sci. https://doi.org/10.3390/app12168310
Bai L, Hu M, Ma Y, Liu M (2019) A hybrid two-phase recommendation for group-buying e-commerce applications. Appl Sci. https://doi.org/10.3390/app9153141
Barman D, Chowdhury N (2019) A novel approach for the customer segmentation using clustering through self-organizing map. Int J Bus Anal 6(2):23–45. https://doi.org/10.4018/IJBAN.2019040102
Bellini P, Palesi LAI, Nesi P, Pantaleo G (2022) Multi clustering recommendation system for fashion retail. Multimed Tools Appl. https://doi.org/10.1007/s11042-021-11837-5
Ben Ayed A, Ben Halima M, Alimi AM (2014) Survey on clustering methods: Towards fuzzy clustering for big data. In: 2014 6th international conference of soft computing and pattern recognition (SoCPaR) (pp 331-336). https://doi.org/10.1109/SOCPAR.2014.7008028
Bezdek JC, Ehrlich R, Full W (1984) FCM: The fuzzy c-means clustering algorithm. Comput Geosci 10(2–3):191–203. https://doi.org/10.1016/0098-3004(84)90020-7
Bian J, Dong A, He X, Reddy S, Chang Y (2013) User action interpretation for online content optimization. IEEE Trans Knowl Data Eng 25(9):2161–2174. https://doi.org/10.1109/TKDE.2012.130
Birtolo C, Diessa V, De Chiara D, Ritrovato P (2013) Customer churn detection system: identifying customers who wish to leave a merchant. In: International conference on industrial, engineering and other applications of applied intelligent systems (pp 411–420)
Boettcher M, Spott M, Nauck D, Kruse R (2009) Mining changing customer segments in dynamic markets. Expert Syst Appl 36(1):155–164. https://doi.org/10.1016/j.eswa.2007.09.006
Brito PQ, Soares C, Almeida S, Monte A, Byvoet M (2015) Customer segmentation in a large database of an online customized fashion business. Robot Comput-Integr Manuf 36:93–100. https://doi.org/10.1016/j.rcim.2014.12.014
Burri M, Schär R (2016) The reform of the EU data protection framework: outlining key changes and assessing their fitness for a data-driven economy. J Inf Policy 6(1):479–511
Caliński T, Harabasz J (1974) A dendrite method for cluster analysis. Commun Stat-Theory Methods 3(1):1–27
Chalupa S, Petricek M (2022) Understanding customer’s online booking intentions using hotel big data analysis. J Vacat Mark. https://doi.org/10.1177/13567667221122107
Chan CCH (2008) Intelligent value-based customer segmentation method for campaign management: a case study of automobile retailer. Expert Syst Appl 34(4):2754–2762
Chan C-CH, Cheng C-B, Hsien W-C (2011) Pricing and promotion strategies of an online shop based on customer segmentation and multiple objective decision making. Expert Syst Appl 38(12):14585–14591. https://doi.org/10.1016/j.eswa.2011.05.024
Chan CCH, Hwang Y-R, Wu H-C (2016) Marketing segmentation using the particle swarm optimization algorithm: a case study. J Ambient Intell Humaniz Comput 7(6):855–863. https://doi.org/10.1007/s12652-016-0389-9
Chang H-C, Tsai H-P (2011) Group RFM analysis as a novel framework to discover better customer consumption behavior. Expert Syst Appl 38(12):14499–14513. https://doi.org/10.1016/j.eswa.2011.05.034
Chen X, Fang Y, Yang M, Nie F, Zhao Z, Huang JZ (2018) Purtreeclust: a clustering algorithm for customer segmentation from massive customer transaction data. IEEE Trans Knowl Data Eng 30(3):559–572. https://doi.org/10.1109/TKDE.2017.2763620
Chen X, Sun W, Wang B, Li Z, Wang X, Ye Y (2019) Spectral clustering of customer transaction data with a two-level subspace weighting method. IEEE Trans Cybern 49(9):3230–3241. https://doi.org/10.1109/TCYB.2018.2836804
Christy AJ, Umamakeswari A, Priyatharsini L, Neyaa A (2018) RFM ranking—an effective approach to customer segmentation. J King Saud Univ-Comput Inf Sci 32(10):1215. https://doi.org/10.1016/j.jksuci.2018.09.004
Cooper HM (1988) Organizing knowledge syntheses: a taxonomy of literature reviews. Knowl Soc 1(1):104–126. https://doi.org/10.1007/BF03177550
Coussement K, van den Bossche FAM, de Bock KW (2014) Data accuracy’s impact on segmentation performance: benchmarking RFM analysis, logistic regression, and decision trees. J Bus Res 67(1):2751–2758. https://doi.org/10.1016/j.jbusres.2012.09.024
Davies DL, Bouldin DW (1979) A cluster separation measure. IEEE Trans Pattern Anal Mach Intell PAMI 1(2):224–227. https://doi.org/10.1109/TPAMI.1979.4766909
De Jong K (2016) Evolutionary computation: a unified approach. In: Proceedings of the 2016 on genetic and evolutionary computation conference companion (pp 185–199)
de Marco M, Fantozzi P, Fornaro C, Laura L, Miloso A (2021) Cognitive analytics management of the customer lifetime value: an artificial neural network approach. J Enterp Inf Manag 34(2):679–696. https://doi.org/10.1108/JEIM-01-2020-0029
Dempster AP, Laird NM, Rubin DB (1977) Maximum likelihood from incomplete data via the EM algorithm. J R Stat Soc Ser B (Methodol) 39(1):1–22
Deng Y, Gao Q (2020) A study on e-commerce customer segmentation management based on improved k-means algorithm. Inf Syst E-Bus Manag 18(4):497–510. https://doi.org/10.1007/s10257-018-0381-3
Dhandayudam P, Krishnamurthi I (2014) Rough set approach for characterizing customer behavior. Arab J Sci Eng 39(6):4565–4576. https://doi.org/10.1007/s13369-014-1013-y
Di Zhang, Huang M (2022) A precision marketing strategy of e-commerce platform based on consumer behavior analysis in the era of big data. Math Prob Eng. https://doi.org/10.1155/2022/8580561
Ding L, Han B, Wang S, Li X, Song B (2019) User-centered recommendation using US-ELM based on dynamic graph model in ecommerce. Int J Mach Learn Cybern 10(4):693–703. https://doi.org/10.1007/s13042-017-0751-z
Dogan O, Aycin E, Bulut ZA (2018) Customer segmentation by using RFM model and clustering methods: a case study in retail industry. Int J Contemp Econ Admin Sci 8(1):1–19
Dogan O, Seymen OF, Hiziroglu A (2022) Customer behavior analysis by intuitionistic fuzzy segmentation: comparison of two major cities in turkey. Int J Inf Technol Decis Mak 21(02):707–727. https://doi.org/10.1142/S0219622021500607
Donath W, Hoffman A (1973) Lower bounds for the partitioning of graphs. IBM J Res Dev 17(5):420–425
Dunn JC (1973) A fuzzy relative of the ISODATA process and its use in detecting compact well-separated clusters. J Cybern. https://doi.org/10.1080/01969727308546046
Eiben AE, Smith JE (2003) Introduction to evolutionary computing, vol 53. Springer, Berlin
European-Parliament (2016) Regulation (eu) 2016/679 of the european parliament and of the council. https://eur-lex.europa.eu/legal-content/EN/TXT/PDF/?uri=CELEX:32016R0679. Accessed 7 June 2023
Fan Y, Huang GQ (2007) Networked manufacturing and mass customization in the ecommerce era: the Chinese perspective. Taylor & Francis, Milton Park
Fiedler M (1973) Algebraic connectivity of graphs. Czechoslov Math J 23(2):298–305
Firdaus S, Uddin MA (2015) A survey on clustering algorithms and complexity analysis. Int J Comput Sci Issues (IJCSI) 12(2):62
Gautam N, Kumar N (2022) Customer segmentation using k-means clustering for developing sustainable marketing strategies. Biznes Inf-Bus Inf 16(1): 72–82. https://doi.org/10.17323/2587-814X.2022.1.72.82
Gennari JH (1989) A survey of clustering methods
Gomes MA, Meyes R, Meisen P, Meisen T (2022) Will this online shopping session succeed? predicting customer’s purchase intention using embeddings. In: Proceedings of the 31st ACM international conference on information & knowledge management (p. 2873–2882). Association for Computing Machinery, New York, NY, USA. Retrieved from https://doi.org/10.1145/3511808.3557127
Goto M, Mikawa K, Hirasawa S, Kobayashi M, Suko T, Horii S (2015) A new latent class model for analysis of purchasing and browsing histories on EC sites. Ind Eng Manag Syst 14(4):335–346. https://doi.org/10.7232/iems.2015.14.4.335
Griva A (2022) “I can get no e-satisfaction". what analytics say? evidence using satisfaction data from e-commerce. J Retail Consum Serv. https://doi.org/10.1016/j.jretconser.2022.102954
Griva A, Bardaki C, Pramatari K, Doukidis G (2021) Factors affecting customer analytics: evidence from three retail cases. Inf Syst Front. https://doi.org/10.1007/s10796-020-10098-1
Griva A, Zampou E, Stavrou V, Papakiriakopoulos D, Doukidis G (2022) A two-stage business analytics approach to perform behavioural and geographic customer segmentation using e-commerce delivery data. J Decis Syst. https://doi.org/10.1080/12460125.2022.2151071
Guney S, Peker S, Turhan C (2020) A combined approach for customer profiling in video on demand services using clustering and association rule mining. IEEE Access 8:84326–84335. https://doi.org/10.1109/ACCESS.2020.2992064
Hafshejani ZY, Kaedi M, Fatemi A (2018) Improving sparsity and new user problems in collaborative filtering by clustering the personality factors. Electron Commer Res 18(4):813–836. https://doi.org/10.1007/s10660-018-9287-x
Hiziroglu A (2013) Soft computing applications in customer segmentation: state-of-art review and critique. Expert Syst Appl 40(16):6491–6507. https://doi.org/10.1016/j.eswa.2013.05.052
Hiziroglu A, Sisci M, Cebeci HI, Seymen OF (2018) An empirical assessment of customer lifetime value models within data mining. Baltic J Modern Comput 6(4): 434–448. https://doi.org/10.22364/bjmc.2018.6.4.08
Hjort K, Lantz B, Ericsson D, Gattorna J (2013) Customer segmentation based on buying and returning behaviour. Int J Phys Distrib Logist Manag 43(10):852–865. https://doi.org/10.1108/IJPDLM-02-2013-0020
Hong T, Kim E (2012) Segmenting customers in online stores based on factors that affect the customer’s intention to purchase. Expert Syst Appl 39(2):2127–2131. https://doi.org/10.1016/j.eswa.2011.07.114
Hotelling H (1933) Analysis of a complex of statistical variables into principal components. J Educ Psychol 24(6):417
Hsieh NC (2004) An integrated data mining and behavioral scoring model for analyzing bank customers. Expert Syst Appl 27(4):623–633. https://doi.org/10.1016/j.eswa.2004.06.007
Hsu P-Y, Huang C-W (2020) IECT: a methodology for identifying critical products using purchase transactions. Appl Soft Comput. https://doi.org/10.1016/j.asoc.2020.106420
Hsu C-C, Y-gC Chen (2007) Mining of mixed data with application to catalog marketing. Expert Syst Appl 32(1):12–23. https://doi.org/10.1016/j.eswa.2005.11.017
Hsu F-M, Lu L-P, Lin C-M (2012) Segmenting customers by transaction data with concept hierarchy. Expert Syst Appl 39(6):6221–6228. https://doi.org/10.1016/j.eswa.2011.12.005
Hu Y-H, Yeh T-W (2014) Discovering valuable frequent patterns based on RFM analysis without customer identification information. Knowl-Based Syst 61:76–88. https://doi.org/10.1016/j.knosys.2014.02.009
Hughes AM (1994) Strategic database marketing: the masterplan for starting and managing a profitable, customer-based marketing program. Irwin Professional, USA
Jadwal PK, Pathak S, Jain S (2022) Analysis of clustering algorithms for credit risk evaluation using multiple correspondence analysis. Microsyst Technol-Micro- Nanosystemsinf Storage Process Syst 28(12):2715–2721. https://doi.org/10.1007/s00542-022-05310-y
Jiang T, Tuzhilin A (2009) Improving personalization solutions through optimal segmentation of customer bases. IEEE Trans Knowl Data Eng 21(3):305–320. https://doi.org/10.1109/TKDE.2008.163
Jonker JJ, Piersma N, van den Poel D (2004) Joint optimization of customer segmentation and marketing policy to maximize long-term profitability. Expert Syst Appl 27(2):159–168. https://doi.org/10.1016/j.eswa.2004.01.010
Kanchanapoom K, Chongwatpol J (2022) Integrated customer lifetime value (CLV) and customer migration model to improve customer segmentation. J Mark Anal. https://doi.org/10.1057/s41270-022-00158-7
Kang P, Cho S, MacLachlan DL (2012) Improved response modeling based on clustering, under-sampling, and ensemble. Expert Syst Appl 39(8):6738–6753. https://doi.org/10.1016/j.eswa.2011.12.028
Kass GV (1980) An exploratory technique for investigating large quantities of categorical data. J R Stat Soc Ser C (Appl Stat) 29(2):119–127
Kendall MG (1938) A new measure of rank correlation. Biometrika 30(1/2):81–93
Kennedy J, Eberhart R (1995) Particle swarm optimization. In: Proceedings of ICNN’95-international conference on neural networks (vol 4, pp 1942–1948)
Kim KJ, Ahn H (2004) Using a clustering genetic algorithm to support customer segmentation for personalized recommender systems. In: Kim TG (eds) Artificial intelligence and simulation (vol 3397, pp 409–415)
Kohonen T (1982) Self-organized formation of topologically correct feature maps. Biol Cybern 43(1):59–69
Krishna GJ, Ravi V (2021) High utility itemset mining using binary differential evolution: an application to customer segmentation. Expert Syst Appl. https://doi.org/10.1016/j.eswa.2021.115122
Kumar V, Venkatesan R, Reinartz W (2008) Performance implications of adopting a customer-focused sales campaign. J Mark 72(5):50–68
Lam HY, Tsang YP, Wu CH, Tang V (2021) Data analytics and the P2P cloud: an integrated model for strategy formulation based on customer behaviour. Peer-to-Peer Netw Appl 14(5):2600–2617. https://doi.org/10.1007/s12083-020-00960-z
Lazarsfeld PF (1950) The logical and mathematical foundation of latent structure analysis. Stud Soc Psychol World War II Vol. IV Meas Predict 362–412
Li J, Wang K, Xu L (2009) Chameleon based on clustering feature tree and its application in customer segmentation. Ann Oper Res 168(1):225–245. https://doi.org/10.1007/s10479-008-0368-4
Li K, Rollins J, Yan E (2018) Web of science use in published research and review papers 1997–2017: a selective, dynamic, cross-domain, content based analysis. Scientometrics 115(1):1–20
Liao J, Jantan A, Ruan Y, Zhou C (2022) Multi-behavior RFM model based on improved SOM neural network algorithm for customer segmentation. IEEE Access 10:122501–122512. https://doi.org/10.1109/ACCESS.2022.3223361
Liu D-R, Lai C-H, Lee W-J (2009) A hybrid of sequential rules and collaborative filtering for product recommendation. Inf Sci 179(20):3505–3519. https://doi.org/10.1016/j.ins.2009.06.004
Liu Y, Li H, Peng G, Lv B, Zhang C (2015) Online purchaser segmentation and promotion strategy selection: evidence from Chinese e-commerce market. Ann Oper Res 233(1):263–279. https://doi.org/10.1007/s10479-013-1443-z
Lloyd S (1982) Least squares quantization in PCM. IEEE Trans Inf Theory 28(2):129–137
Logesh R, Subramaniyaswamy V, Vijayakumar V, Gao X-Z, Wang G-G (2020) Hybrid bio-inspired user clustering for the generation of diversified recommendations. Neural Comput Appl 32(7):2487–2506. https://doi.org/10.1007/s00521-019-04128-6
Ma X, Lu H, Gan Z, Zhao Q (2016) An exploration of improving prediction accuracy by constructing a multi-type clustering based recommendation framework. Neurocomputing 191:388–397. https://doi.org/10.1016/j.neucom.2016.01.040
MacQueen J (1967) Some methods for classification and analysis of multivariate observations. In: Proceedings of the fifth Berkeley symposium on mathematical statistics and probability (vol 1, pp 281–297)
Madzik P, Shahin A (2021) Customer categorization using a three-dimensional loyalty matrix analogous to FMEA. Int J Qual Reliab Manag 38(8):1833–1857. https://doi.org/10.1108/IJQRM-05-2020-0179
Maimon O, Rokach L (2005) Data mining and knowledge discovery handbook. Springer, Berlin
Mensouri D, Azmani A, Azmani M (2022) K-means customers clustering by their RMFT and score satisfaction analysis. Int J Adv Comput Sci Appl 13(6): 469–476. https://doi.org/10.14569/IJACSA.2022.0130658
Mikolov T, Sutskever I, Chen K, Corrado GS, Dean J (2013) Distributed representations of words and phrases and their compositionality. Adv Neural Inf Process Syst 26
Mosa M, Agami N, Elkhayat G, Kholief M (2022) A novel hybrid segmentation approach for decision support: a case study in banking. Comput J. https://doi.org/10.1093/comjnl/bxac009
Mulhern FJ (1999) Customer profitability analysis: measurement, concentration, and research directions. J Interact Mark 13(1):25–40
Munusamy S, Murugesan P (2020) Modified dynamic fuzzy c-means clustering algorithm—application in dynamic customer segmentation. Appl Intell 50(6):1922–1942. https://doi.org/10.1007/s10489-019-01626-x
Nakano S, Kondo FN (2018) Customer segmentation with purchase channels and media touchpoints using single source panel data. J Retail Consum Serv 41:142–152. https://doi.org/10.1016/j.jretconser.2017.11.012
Nalmpantis C, Vrakas D (2019) Signal2vec: time series embedding representation. In: International conference on engineering applications of neural networks (pp 80–90)
Nemati Y, Mohaghar A, Alavidoost MH, Babazadeh H (2018) A CLV-based framework to prioritize promotion marketing strategies: a case study of telecom industry. Iran J Manag Stud 11 (3): 437–462https://doi.org/10.22059/ijms.2018.242492.672837
Nguyen SP (2021) Deep customer segmentation with applications to a Vietnamese supermarkets’ data. Soft Comput 25(12):7785–7793. https://doi.org/10.1007/s00500-021-05796-0
Nie D, Cappellari P, Roantree M (2021) A methodology for classification and validation of customer datasets. J Bus Ind Mark 36(5):821–833. https://doi.org/10.1108/JBIM-02-2020-0077
Nilashi M, Samad S, Minaei-Bidgoli B, Ghabban F, Supriyanto E (2021) Online reviews analysis for customer segmentation through dimensionality reduction and deep learning techniques. Arab J Sci Eng 46(9):8697–8709. https://doi.org/10.1007/s13369-021-05638-z
Ozer M (2001) User segmentation of online music services using fuzzy clustering. OMEGA-Int J Manag Sci 29(2):193–206. https://doi.org/10.1016/S0305-0483(00)00042-6
Pawlak Z (1982) Rough sets. Int J Comput Inf Sci 11(5):341–356
Pearson K (1901) LIII. On lines and planes of closest fit to systems of points in space. Lond Edinb Dublin Philos Mag J Sci 2(11):559–572
Peker S, Kocyigit A, Eren PE (2017) LRFMP model for customer segmentation in the grocery retail industry: a case study. Mark Intell Plan 35(4):544–559. https://doi.org/10.1108/MIP-11-2016-0210
Pratama BY, Budi I, Yuliawati A (2020) Product recommendation in offline retail industry by using collaborative filtering. Int J Adv Comput Sci Appl 11(9):635–643
Rahim MA, Mushafiq M, Khan S, Arain ZA (2021) RFM-based repurchase behavior for customer classification and segmentation. J Retail Consum Serv. https://doi.org/10.1016/j.jretconser.2021.102566
Ramadas M, Abraham A (2018) Data clustering using eDE, an enhanced differential evolution algorithm with fuzzy c-means technique. Turk J Electr Eng Comput Sci 26(2):867–881. https://doi.org/10.3906/elk-1706-104
Rapecka A, Dzemyda G (2015) A new recommendation method for the user clustering-based recommendation system. Inf Technol Control 44(1):54–63. https://doi.org/10.5755/j01.itc.44.1.5931
Ravasan AZ, Mansouri T (2015) A fuzzy ANP based weighted RFM model for customer segmentation in auto insurance sector. Int J Inf Syst Serv Sect 7(2):71–86. https://doi.org/10.4018/ijisss.2015040105
Reddy CK, Vinzamuri B (2018) A survey of partitional and hierarchical clustering algorithms. In: Data clustering (pp 87–110). Chapman and Hall, London. https://doi.org/10.1201/9781315373515-4
Rezaeinia SM, Rahmani R (2016) Recommender system based on customer segmentation (RSCS). Kybernetes 45(6):946–961. https://doi.org/10.1108/K-07-2014-0130
Rokach L (2010) A survey of clustering algorithms. In: Data mining and knowledge discovery handbook (pp 269–298). Springer US, Boston. https://doi.org/10.1007/978-0-387-09823-414
Rousseeuw PJ (1987) Silhouettes: a graphical aid to the interpretation and validation of cluster analysis. J Comput Appl Math 20:53–65. https://doi.org/10.1016/0377-0427(87)90125-7
Safari F, Safari N, Montazer GA (2016) Customer lifetime value determination based on RFM model. Mark Intell Plan 34(4):446–461. https://doi.org/10.1108/MIP-03-2015-0060
Sari JN, Nugroho LE, Ferdiana R, Santosa PI (2016) Review on customer segmentation technique on ecommerce. Adv Sci Lett 22(10):3018–3022
Sarvari PA, Ustundag A, Takci H (2016) Performance evaluation of different customer segmentation approaches based on RFM and demographics analysis. Kybernetes 45(7):1129–1157. https://doi.org/10.1108/K-07-2015-0180
Shi Z, Pun-Cheng LS (2019) Spatiotemporal data clustering: a survey of methods. ISPRS Int J Geoinf 8(3):112
Simoes D, Nogueira J (2021) Learning about the customer for improving customer retention proposal of an analytical framework. J Mark Anal. https://doi.org/10.1057/s41270-021-00126-7
Sivaguru M, Punniyamoorthy M (2021) Performance-enhanced rough k-means clustering algorithm. Soft Comput 25(2):1595–1616. https://doi.org/10.1007/s00500-020-05247-2
Sivaramakrishnan N, Subramaniyaswamy V, Ravi L, Vijayakumar V, Gao X-Z, Sri SLR (2020) An effective user clustering-based collaborative filtering recommender system with grey wolf optimisation. Int J Bio-Inspir Comput 16(1):44–55. https://doi.org/10.1504/IJBIC.2020.108999
Sokol O, Holy V (2021) The role of shopping mission in retail customer segmentation. Int J Mark Res 63(4):454–470. https://doi.org/10.1177/1470785320921011
Song Q, Shepperd M (2006) Mining web browsing patterns for E-commerce. Comput Ind 57(7):622–630. https://doi.org/10.1016/j.compind.2005.11.006
Srilakshmi M, Chowdhury G, Sarkar S (2022) Two-stage system using item features for next-item recommendation. Intell Syst Appl 14:200070. https://doi.org/10.1016/j.iswa.2022.200070
Statista.com (2022) Video-streaming (SVOD). Retrieved 12-02-2022, from https://www.statista.com/outlook/dmo/digital-media/videoon-demand/video-streaming-svod/worldwide
Stormi K, Lindholm A, Laine T, Korhonen T (2020) RFM customer analysis for product-oriented services and service business development: an interventionist case study of two machinery manufacturers. J Manag Gov 24(3):623–653. https://doi.org/10.1007/s10997-018-9447-3
Sun F, Liu J, Wu J, Pei C, Lin X, Ou W, Jiang P (2019) Bert4rec: sequential recommendation with bidirectional encoder representations from transformer. In: Proceedings of the 28th ACM international conference on information and knowledge management (pp 1441–1450)
Tabianan K, Velu S, Ravi V (2022) K-means clustering approach for intelligent customer segmentation using customer purchase behavior data. Sustainability. https://doi.org/10.3390/su14127243
Teichert T, Shehu E, vonWartburg I (2008) Customer segmentation revisited: the case of the airline industry. Transp Res Part A Policy Pract 42(1):227–242. https://doi.org/10.1016/j.tra.2007.08.003
Tercan H, Bitter C, Bodnar T, Meisen P, Meisen T (2021) Evaluating a session-based recommender system using prod2vec in a commercial application. In: Proceedings of the 23rd international conference on enterprise information systems (vol 1: Iceis, pp 610–617). SciTePress. https://doi.org/10.5220/0010400706100617
Tsai C-F, Hu Y-H, Lu Y-H (2015) Customer segmentation issues and strategies for an automobile dealership with two clustering techniques. Expert Syst 32(1):65–76. https://doi.org/10.1111/exsy.12056
Umuhoza E, Ntirushwamaboko D, Awuah J, Birir B (2020) Using unsupervised machine learning techniques for behavioral-based credit card users segmentation in Africa. SAIEE Afr Res J 111(3): 95–101. https://doi.org/10.23919/SAIEE.2020.9142602
Valentini S, Neslin SA, Montaguti E (2020) Identifying omnichannel deal prone segments, their antecedents, and their consequences. J Retail 96(3):310–327. https://doi.org/10.1016/j.jretai.2020.01.003
Vasile F, Smirnova E, Conneau A (2016) Meta-prod2vec: product embeddings using side-information for recommendation. In: Proceedings of the 10th ACM conference on recommender systems (pp 225–232)
Verdu SV, Garcia MO, Senabre C, Marin AG, Garcia Franco FJ (2006) Classification, filtering, and identification of electrical customer load patterns through the use of self-organizing maps. IEEE Trans Power Syst 21(4):1672–1682. https://doi.org/10.1109/TPWRS.2006.881133
Vom Brocke J, Simons A, Riemer K, Niehaves B, Plattfaut R, Cleven A (2015) Standing on the shoulders of giants: challenges and recommendations of literature search in information systems research. Commun Assoc Inf Syst 37(1):9
Wan M, Li L, Xiao J, Yang Y, Wang C, Guo X (2010) CAS based clustering algorithm for Web users. Nonlinear Dyn 61(3):347–361. https://doi.org/10.1007/s11071-010-9653-2
Wang C-H (2010) Apply robust segmentation to the service industry using kernel induced fuzzy clustering techniques. Expert Syst Appl 37(12):8395–8400. https://doi.org/10.1016/j.eswa.2010.05.042
Wang FH, Shao HM (2004) Effective personalized recommendation based on time-framed navigation clustering and association mining. Expert Syst Appl 27(3):365–377. https://doi.org/10.1016/j.eswa.2004.05.005
Wang Q, Zhang B (2021) Research and implementation of the customer-oriented modern hotel management system using fuzzy analytic hiererchical process (FAHP). J Intell Fuzzy Syst 40(4):8277–8285. https://doi.org/10.3233/JIFS-189650
Wang Y, Zhou J-T, Li X, Song X (2020) Effective user preference clustering in web service applications. Comput J 63(11):1633–1643. https://doi.org/10.1093/comjnl/bxz090
Wong E, Wei Y (2018) Customer online shopping experience data analytics integrated customer segmentation and customised services prediction model. Int J Retail Distrib Manag 46(4):406–420. https://doi.org/10.1108/IJRDM-06-2017-0130
Wu W-W (2011) Segmenting and mining the ERP users’ perceived benefits using the rough set approach. Expert Syst Appl 38(6):6940–6948. https://doi.org/10.1016/j.eswa.2010.12.030
Wu R-S, Chou P-H (2011) Customer segmentation of multiple category data in e-commerce using a soft-clustering approach. Electron Commer Res Appl 10(3):331–341. https://doi.org/10.1016/j.elerap.2010.11.002
Wu J, Shi L, Lin W-P, Tsai S-B, Li Y, Yang L, Xu G (2020) An empirical study on customer segmentation by purchase behaviors using a RFM model and k-means algorithm. Math Probl Eng. https://doi.org/10.1155/2020/8884227
Wu J, Shi L, Yang L, Niu X, Li Y, Cui X, Zhang Y (2021) User value identification based on improved RFM model and k-means plus plus algorithm for complex data analysis. Wirel Commun Mob Comput. https://doi.org/10.1155/2021/9982484
Wu Z, Jin L, Zhao J, Jing L, Chen L (2022) Research on segmenting e-commerce customer through an improved K-medoids clustering algorithm. Comput Intell Neurosci. https://doi.org/10.1155/2022/9930613
Xie XL, Beni G (1991) A validity measure for fuzzy clustering. IEEE Trans Pattern Anal Mach Intell 13(8):841–847
Zeithaml VA, Rust RT, Lemon KN (2001) The customer pyramid: creating and serving profitable customers. Calif Manag Rev 43(4):118–142
Zhang C-X, Zhang Z-K, Yu L, Liu C, Liu H, Yan X-Y (2014) Information filtering via collaborative user clustering modeling. Phys A Stat Mech Appl 396:195–203. https://doi.org/10.1016/j.physa.2013.11.024
Zhang S, Yao L, Sun A, Tay Y (2019) Deep learning based recommender system: a survey and new perspectives. ACM Comput Surv (CSUR) 52(1):1–38
Zhang F, Qi S, Liu Q, Mao M, Zeng A (2020) Alleviating the data sparsity problem of recommender systems by clustering nodes in bipartite networks. Expert Syst Appl. https://doi.org/10.1016/j.eswa.2020.113346
Zhao H-H, Luo X-C, Ma R, Lu X (2021) An extended regularized K-means clustering approach for high-dimensional customer segmentation with correlated variables. IEEE Access 9:48405–48412. https://doi.org/10.1109/ACCESS.2021.3067499
Zhou J, Wei J, Xu B (2021) Customer segmentation by web content mining. J Retail Consum Serv. https://doi.org/10.1016/j.jretconser.2021.102588
Zhu H, Jia Z, Peng H, Li L (2007) Chaotic ant swarm. In: Third international conference on natural computation (ICNC 2007) (vol 3, pp 446–450). https://doi.org/10.1109/ICNC.2007.296
Funding
Open Access funding enabled and organized by Projekt DEAL.
Author information
Authors and Affiliations
Contributions
The author MAG had the idea for the article, performed the literature search and data analysis, and drafted the article. The author TM mentored the process with his expertise and critically revised the article.
Corresponding author
Ethics declarations
Conflict of interest
The authors declare that they have no known competing financial interests or personal relationships that could have appeared to influence the work reported in this paper.
Additional information
Publisher's Note
Springer Nature remains neutral with regard to jurisdictional claims in published maps and institutional affiliations.
A Table of reviewed literature
A Table of reviewed literature
Rights and permissions
Open Access This article is licensed under a Creative Commons Attribution 4.0 International License, which permits use, sharing, adaptation, distribution and reproduction in any medium or format, as long as you give appropriate credit to the original author(s) and the source, provide a link to the Creative Commons licence, and indicate if changes were made. The images or other third party material in this article are included in the article's Creative Commons licence, unless indicated otherwise in a credit line to the material. If material is not included in the article's Creative Commons licence and your intended use is not permitted by statutory regulation or exceeds the permitted use, you will need to obtain permission directly from the copyright holder. To view a copy of this licence, visit http://creativecommons.org/licenses/by/4.0/.
About this article

Cite this article
Alves Gomes, M., Meisen, T. A review on customer segmentation methods for personalized customer targeting in e-commerce use cases. Inf Syst E-Bus Manage 21, 527–570 (2023). https://doi.org/10.1007/s10257-023-00640-4
Received:
Revised:
Accepted:
Published:
Issue Date:
DOI: https://doi.org/10.1007/s10257-023-00640-4